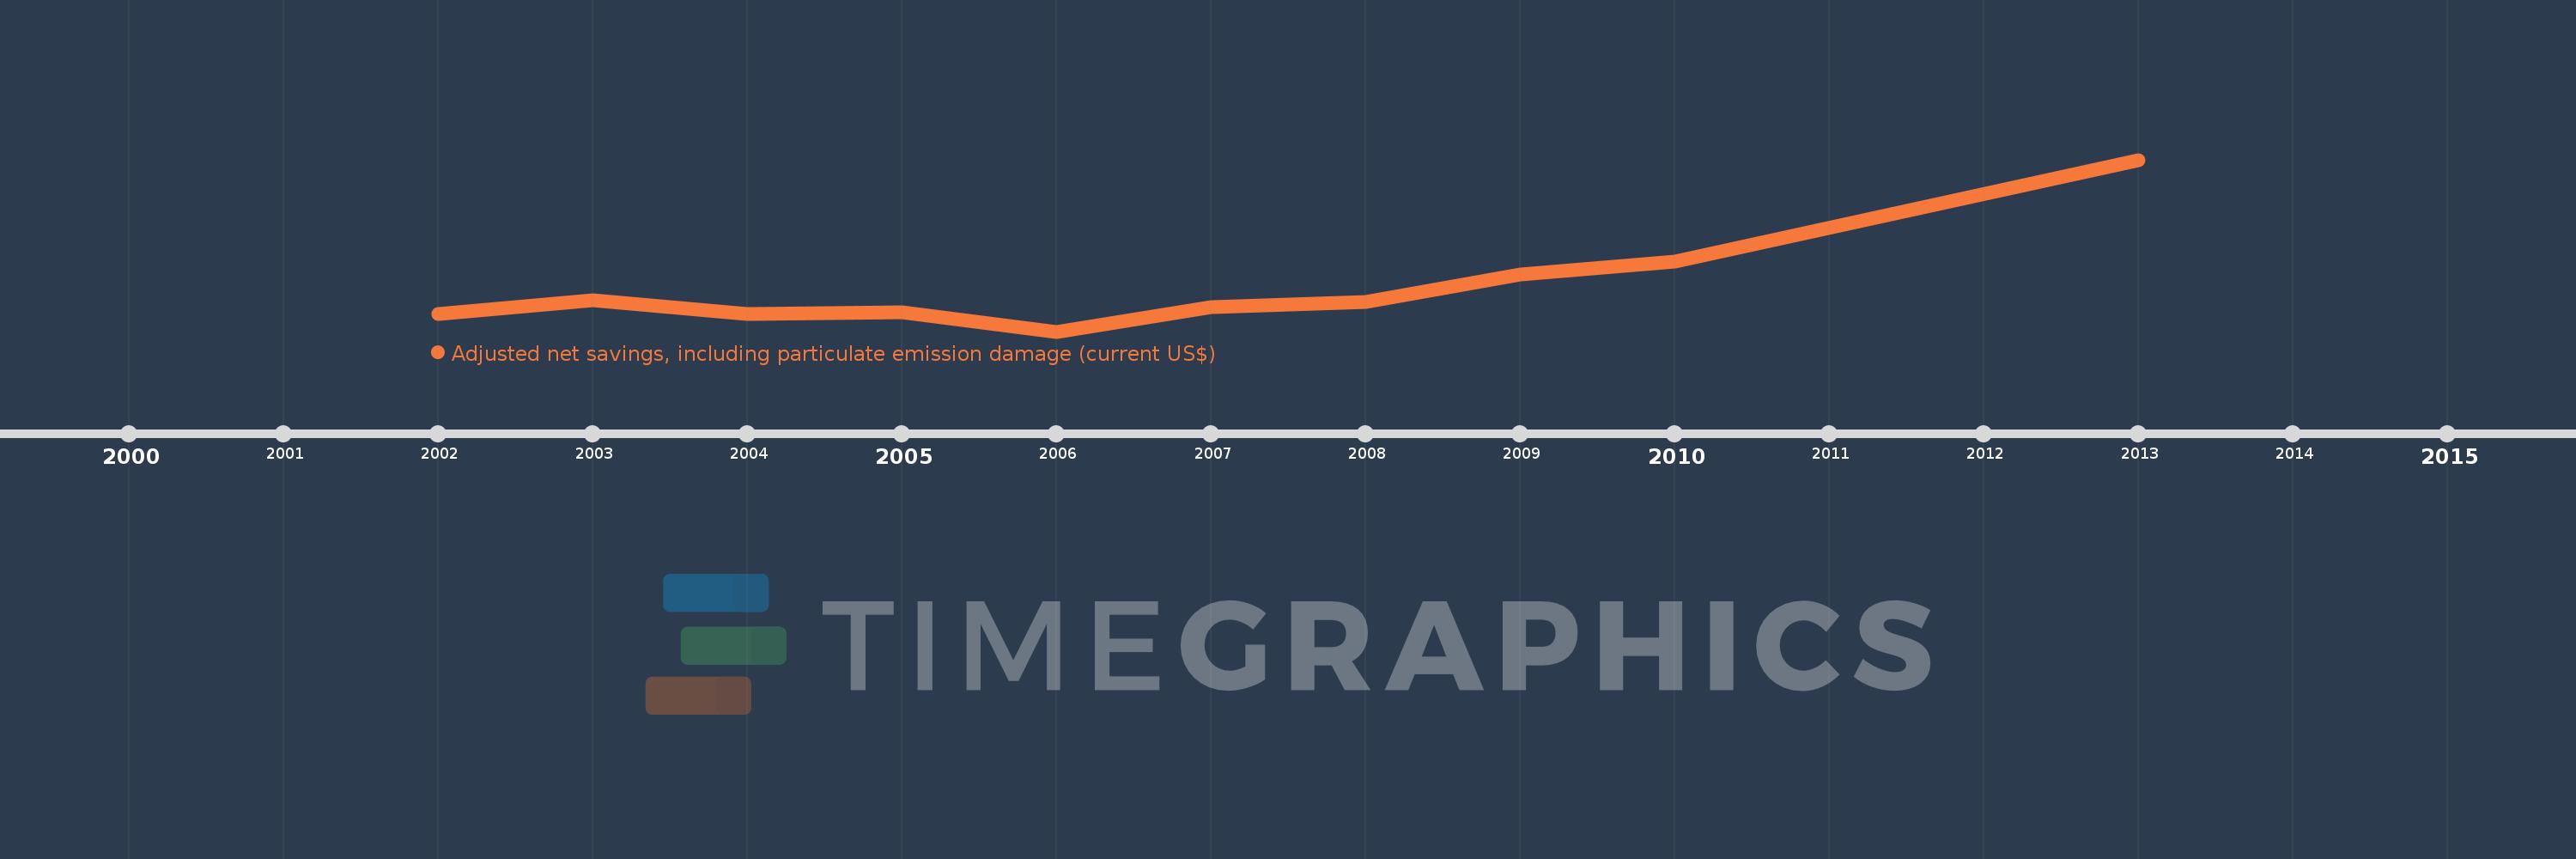
This timeline shows a graph from 2002 to 2013 of Brunei Darussalam. No data until 2001. Number of actual observations by date: 10.
Source name:
World Development Indicators
Source organization:
World Bank staff estimates based on sources and methods in World Bank's "The Changing Wealth of Nations: Measuring Sustainable Development in the New Millennium" (2011).
Categories, topics:
Economy & Growth, Environment
Last updated:
apr 23, 2017
Indicators value changes by year
Meaning:
958.874 mln
Minimum:
-175.153 mln
jan 1, 2006
Maximum:
4.265 bln
jan 1, 2013
At the date of observation
Value
Absolute change
Change from the previous value
jan 1, 2002
275.04 mln
+275.04 mln
0.0%
jan 1, 2003
633.603 mln
+358.563 mln
130.37%
jan 1, 2004
283.066 mln
-350.536 mln
-55.32%
jan 1, 2005
329.927 mln
+46.86 mln
16.55%
jan 1, 2006
-175.153 mln
-505.08 mln
-153.09%
jan 1, 2007
454.165 mln
+629.318 mln
-359.3%
jan 1, 2008
591.839 mln
+137.674 mln
30.31%
jan 1, 2009
1.296 bln
+703.883 mln
118.93%
jan 1, 2010
1.636 bln
+339.802 mln
26.22%
jan 1, 2013
4.265 bln
+2.629 bln
160.77%
Ranking of countries by current statistics by years