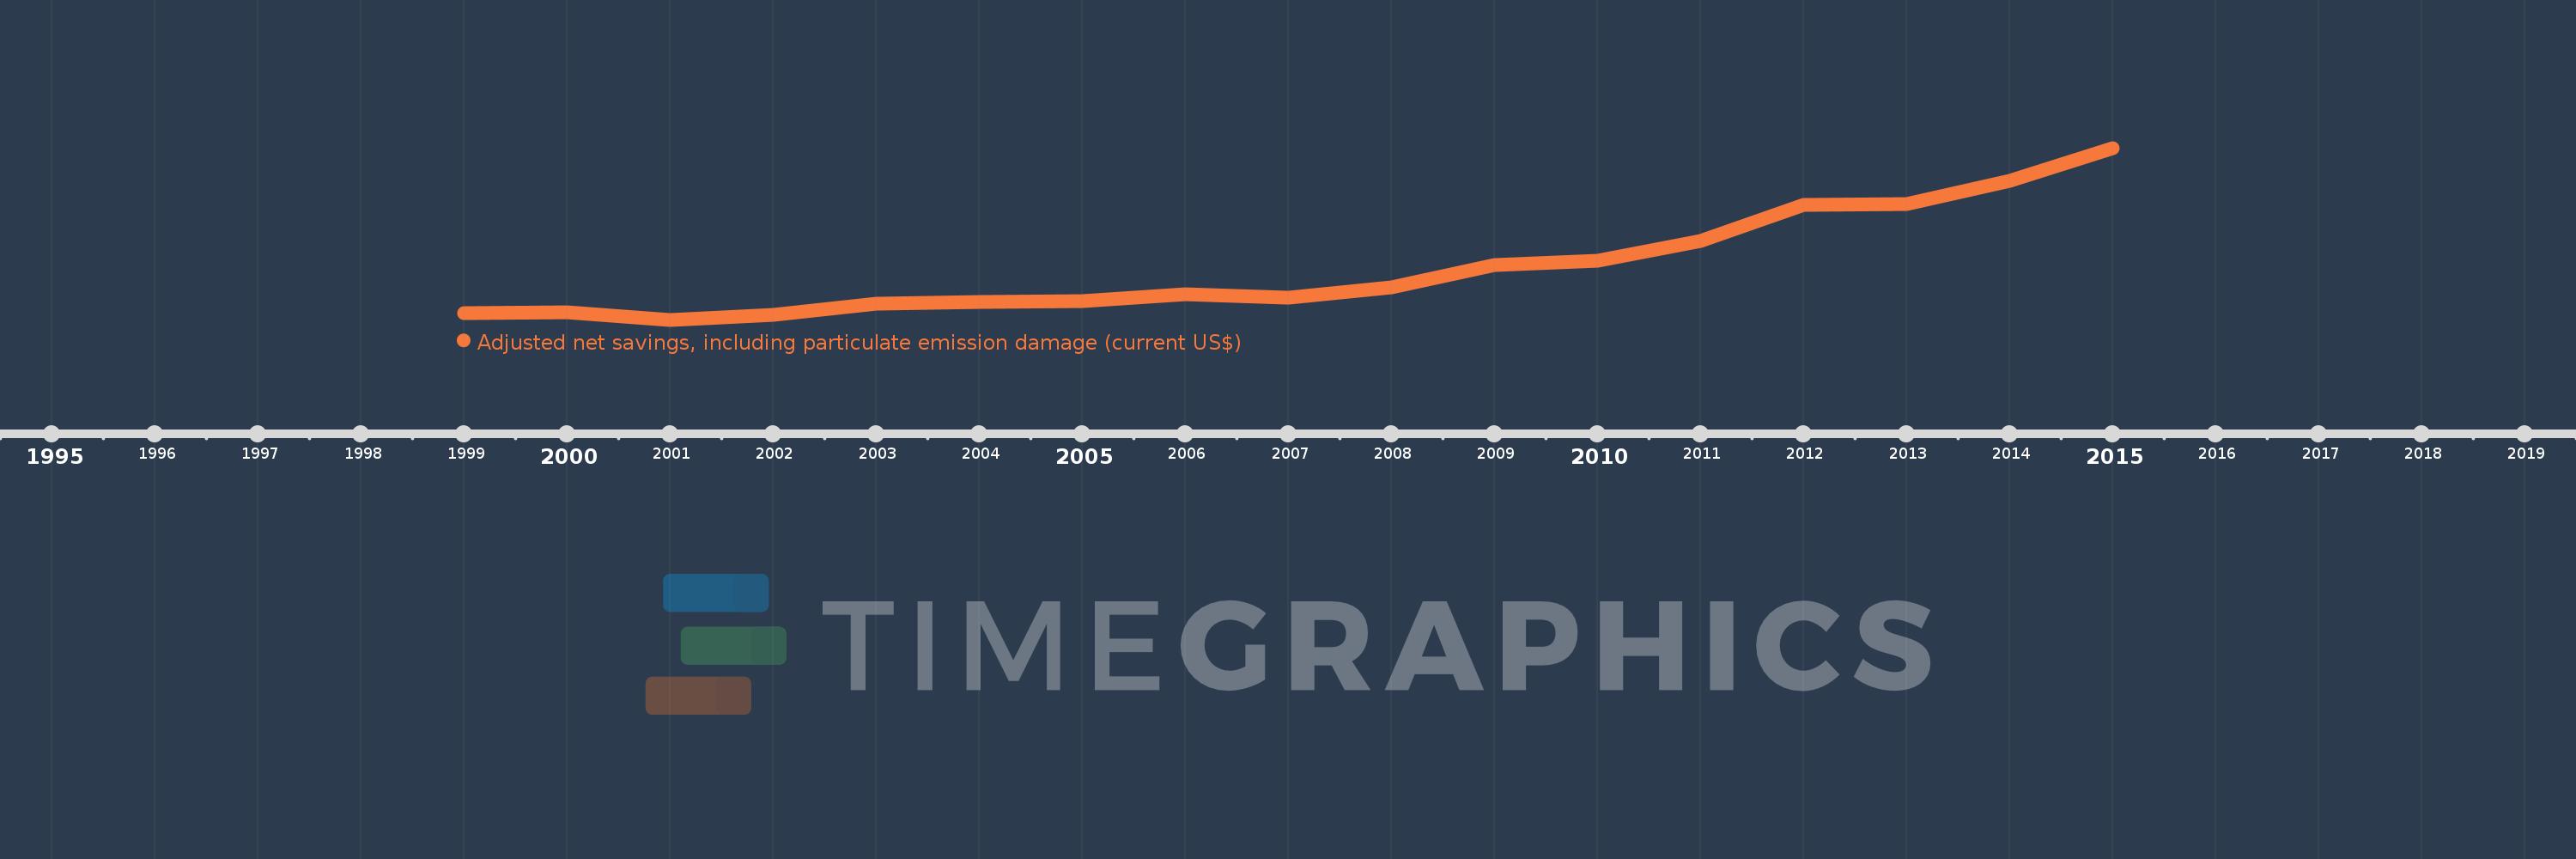
This timeline shows a graph from 1999 to 2015 of Azerbaijan. No data until 1998. Number of actual observations by date: 17.
Source name:
World Development Indicators
Source organization:
World Bank staff estimates based on sources and methods in World Bank's "The Changing Wealth of Nations: Measuring Sustainable Development in the New Millennium" (2011).
Categories, topics:
Economy & Growth, Environment
Last updated:
apr 23, 2017
Indicators value changes by year
Meaning:
2.565 bln
Minimum:
-1.95 bln
jan 1, 2001
Maximum:
12.947 bln
jan 1, 2015
At the date of observation
Value
Absolute change
Change from the previous value
jan 1, 1999
-1.397 bln
-1.397 bln
0.0%
jan 1, 2000
-1.266 bln
+130.82 mln
-9.36%
jan 1, 2001
-1.95 bln
-684.062 mln
54.02%
jan 1, 2002
-1.537 bln
+413.648 mln
-21.21%
jan 1, 2003
-565.023 mln
+971.617 mln
-63.23%
jan 1, 2004
-389.253 mln
+175.77 mln
-31.11%
jan 1, 2005
-332.741 mln
+56.513 mln
-14.52%
jan 1, 2006
291.651 mln
+624.392 mln
-187.65%
jan 1, 2007
-9.211 mln
-300.862 mln
-103.16%
jan 1, 2008
871.822 mln
+881.033 mln
-9.57K%
jan 1, 2009
2.781 bln
+1.909 bln
219.0%
jan 1, 2010
3.144 bln
+362.6 mln
13.04%
jan 1, 2011
4.866 bln
+1.722 bln
54.79%
jan 1, 2012
8.006 bln
+3.14 bln
64.53%
jan 1, 2013
8.05 bln
+43.641 mln
0.55%
jan 1, 2014
10.096 bln
+2.046 bln
25.41%
jan 1, 2015
12.947 bln
+2.851 bln
28.24%
Ranking of countries by current statistics by years