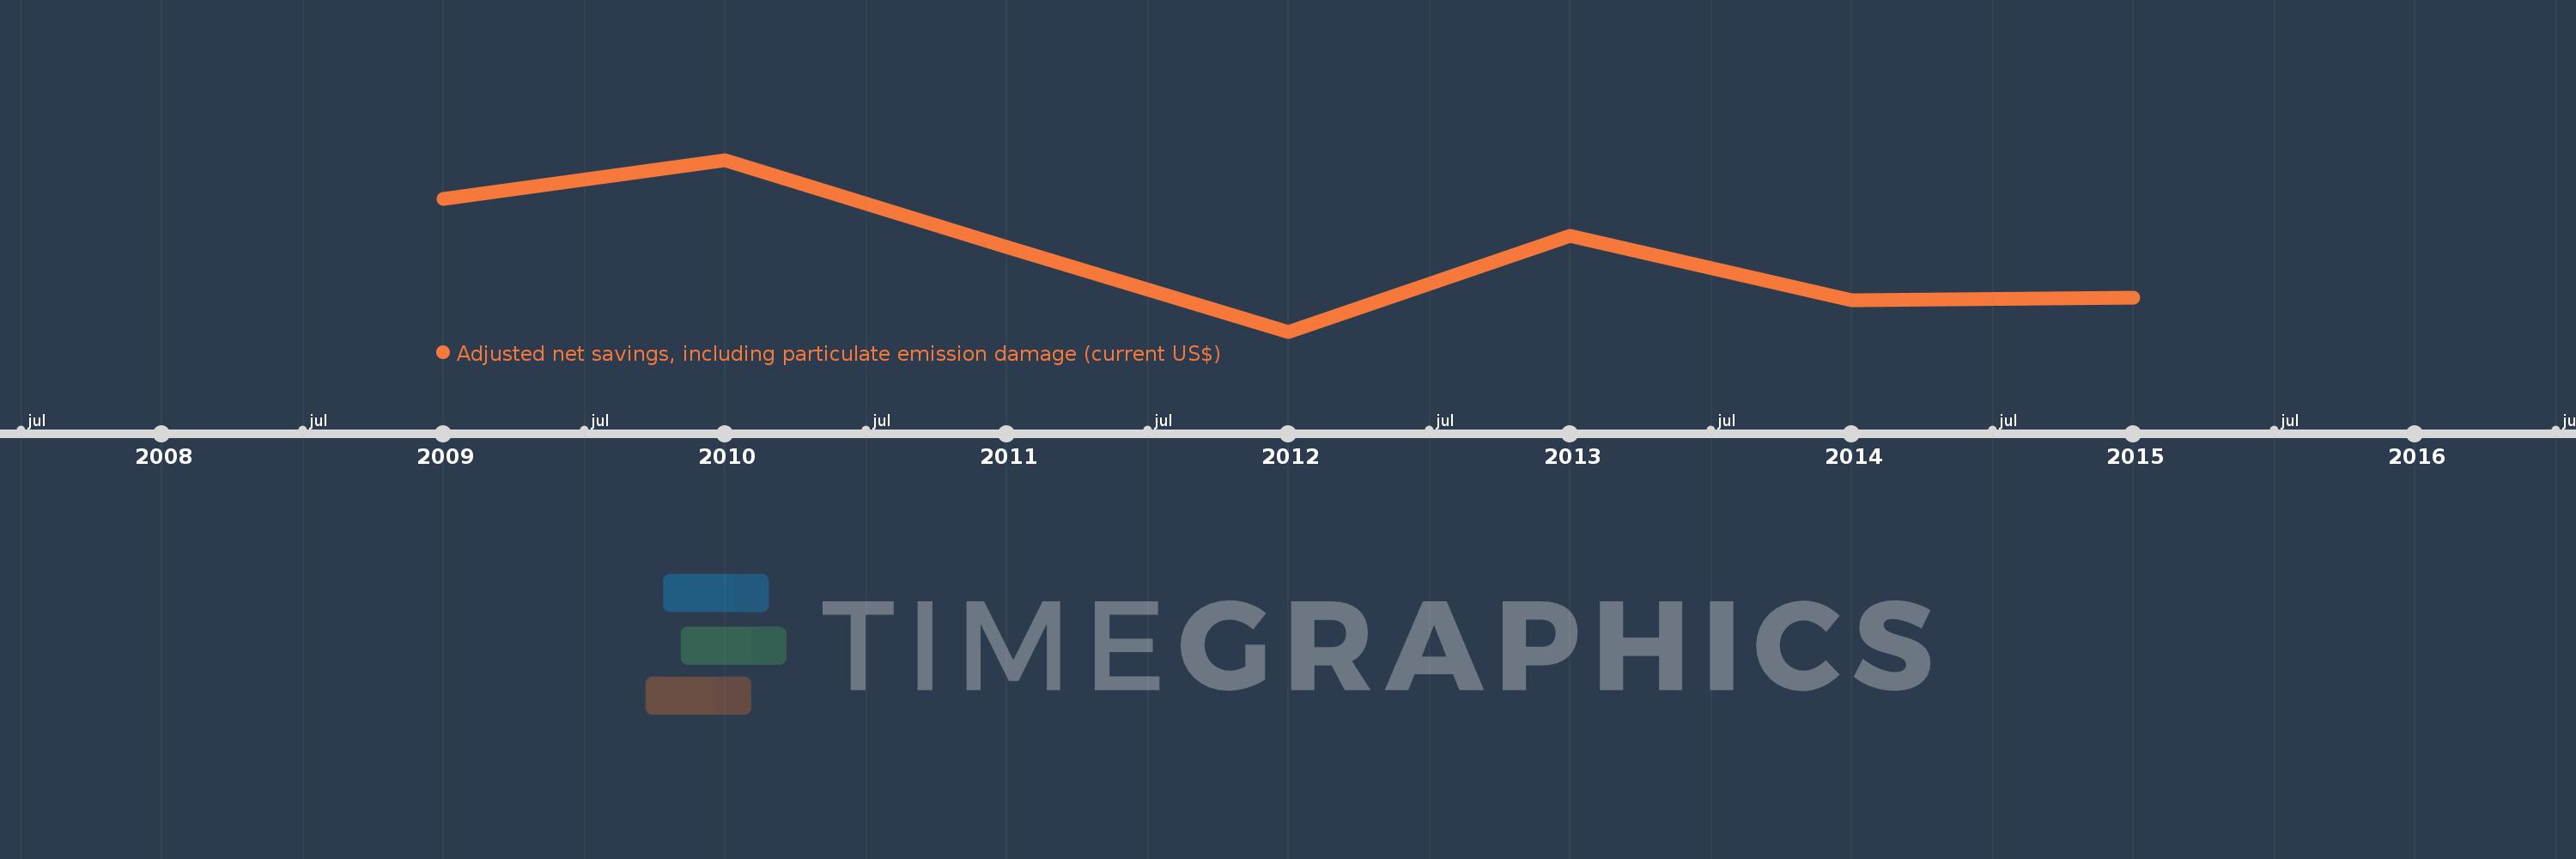
This timeline shows a graph from 2009 to 2015 of Afghanistan. No data until 2008. Number of actual observations by date: 7.
Source name:
World Development Indicators
Source organization:
World Bank staff estimates based on sources and methods in World Bank's "The Changing Wealth of Nations: Measuring Sustainable Development in the New Millennium" (2011).
Categories, topics:
Economy & Growth, Environment
Last updated:
apr 23, 2017
Indicators value changes by year
Meaning:
-3.009 bln
Minimum:
-4.375 bln
jan 1, 2012
Maximum:
-1.394 bln
jan 1, 2010
At the date of observation
Value
Absolute change
Change from the previous value
jan 1, 2009
-2.068 bln
-2.068 bln
0.0%
jan 1, 2010
-1.394 bln
+673.843 mln
-32.59%
jan 1, 2011
-2.903 bln
-1.509 bln
108.27%
jan 1, 2012
-4.375 bln
-1.472 bln
50.72%
jan 1, 2013
-2.707 bln
+1.668 bln
-38.12%
jan 1, 2014
-3.825 bln
-1.118 bln
41.29%
jan 1, 2015
-3.789 bln
+35.947 mln
-0.94%
Ranking of countries by current statistics by years