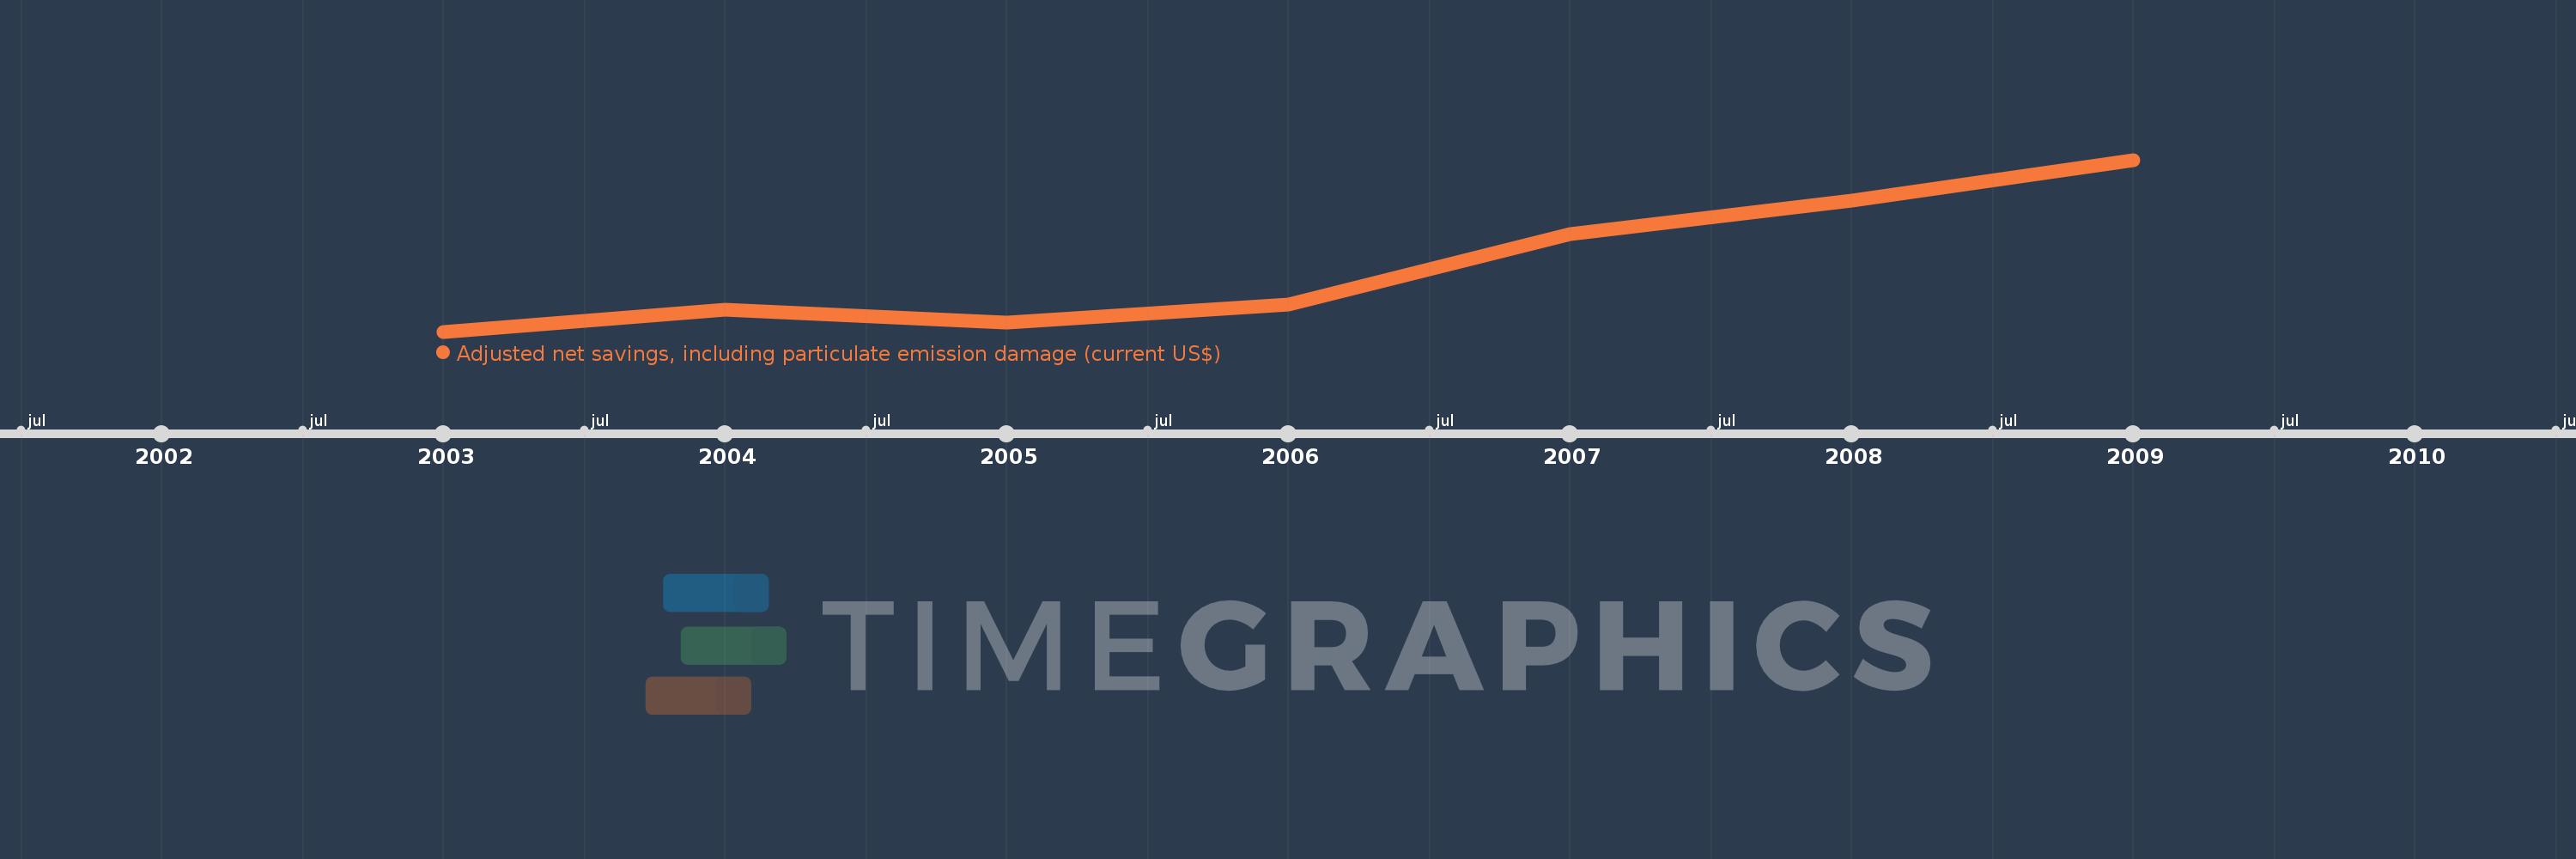
This timeline shows a graph from 2003 to 2009 of Libya. No data until 2002. Number of actual observations by date: 7.
Source name:
World Development Indicators
Source organization:
World Bank staff estimates based on sources and methods in World Bank's "The Changing Wealth of Nations: Measuring Sustainable Development in the New Millennium" (2011).
Categories, topics:
Economy & Growth, Environment
Last updated:
apr 23, 2017
Indicators value changes by year
Meaning:
10.191 bln
Minimum:
-2.012 bln
jan 1, 2003
Maximum:
29.94 bln
jan 1, 2009
At the date of observation
Value
Absolute change
Change from the previous value
jan 1, 2003
-2.012 bln
-2.012 bln
0.0%
jan 1, 2004
2.109 bln
+4.121 bln
-204.81%
jan 1, 2005
-305.688 mln
-2.415 bln
-114.5%
jan 1, 2006
3.085 bln
+3.391 bln
-1.11K%
jan 1, 2007
16.095 bln
+13.01 bln
421.74%
jan 1, 2008
22.423 bln
+6.328 bln
39.32%
jan 1, 2009
29.94 bln
+7.516 bln
33.52%
Ranking of countries by current statistics by years