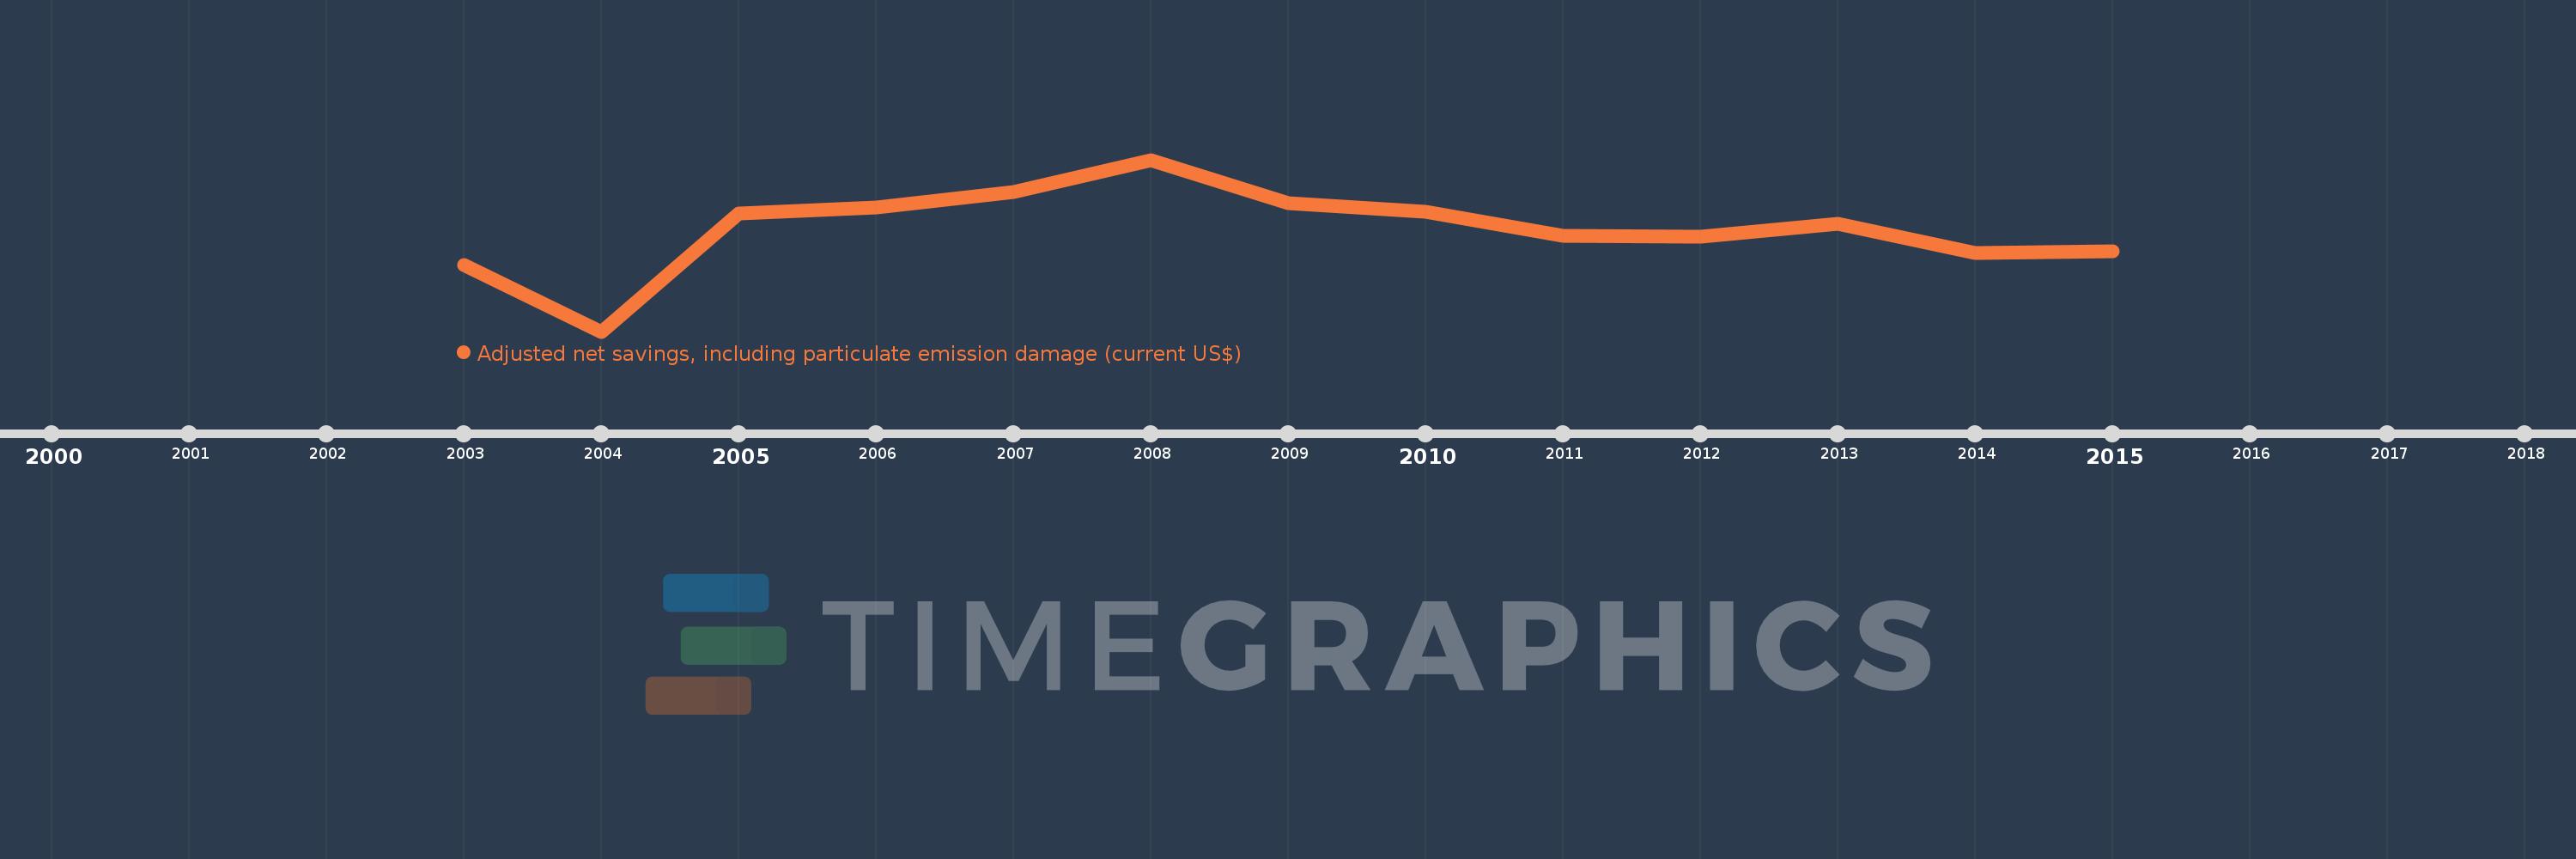
This timeline shows a graph from 2003 to 2015 of Lebanon. No data until 2002. Number of actual observations by date: 13.
Source name:
World Development Indicators
Source organization:
World Bank staff estimates based on sources and methods in World Bank's "The Changing Wealth of Nations: Measuring Sustainable Development in the New Millennium" (2011).
Categories, topics:
Economy & Growth, Environment
Last updated:
apr 23, 2017
Indicators value changes by year
Meaning:
-2.658 bln
Minimum:
-6.701 bln
jan 1, 2004
Maximum:
110.892 mln
jan 1, 2008
At the date of observation
Value
Absolute change
Change from the previous value
jan 1, 2003
-4.055 bln
-4.055 bln
0.0%
jan 1, 2004
-6.701 bln
-2.646 bln
65.25%
jan 1, 2005
-2.017 bln
+4.685 bln
-69.91%
jan 1, 2006
-1.796 bln
+220.76 mln
-10.95%
jan 1, 2007
-1.17 bln
+625.923 mln
-34.85%
jan 1, 2008
110.892 mln
+1.281 bln
-109.48%
jan 1, 2009
-1.608 bln
-1.718 bln
-1.55K%
jan 1, 2010
-1.947 bln
-339.511 mln
21.12%
jan 1, 2011
-2.9 bln
-952.749 mln
48.93%
jan 1, 2012
-2.948 bln
-47.803 mln
1.65%
jan 1, 2013
-2.424 bln
+523.618 mln
-17.76%
jan 1, 2014
-3.581 bln
-1.157 bln
47.72%
jan 1, 2015
-3.525 bln
+56.102 mln
-1.57%
Ranking of countries by current statistics by years