Download This statistics in other country:
AfghanistanAlbaniaAlgeriaAngolaArgentinaArmeniaAustraliaAustriaAzerbaijanBahamas, TheBahrainBangladeshBarbadosBelarusBelgiumBelizeBeninBhutanBoliviaBotswanaBrazilBrunei DarussalamBulgariaBurkina FasoBurundiCabo VerdeCambodiaCameroonCanadaCentral African RepublicChadChileChinaColombiaComorosCongo, Dem. Rep.Congo, Rep.Costa RicaCote d'IvoireCroatiaCyprusCzech RepublicDenmarkDominican RepublicEcuadorEgypt, Arab Rep.El SalvadorEquatorial GuineaEritreaEstoniaEthiopiaFijiFinlandFranceGabonGambia, TheGeorgiaGermanyGhanaGreeceGuatemalaGuineaGuinea-BissauGuyanaHaitiHondurasHungaryIcelandIndiaIndonesiaIran, Islamic Rep.IraqIrelandIsraelItalyJamaicaJapanJordanKazakhstanKenyaKorea, Rep.KuwaitKyrgyz RepublicLao PDRLatviaLebanonLesothoLiberiaLibyaLithuaniaLuxembourgMacedonia, FYRMadagascarMalawiMalaysiaMaldivesMaliMauritaniaMauritiusMexicoMoldovaMongoliaMoroccoMozambiqueNamibiaNepalNetherlandsNew ZealandNicaraguaNigerNigeriaNorwayOmanPakistanPanamaPapua New GuineaParaguayPeruPhilippinesPolandPortugalQatarRomaniaRussian FederationRwandaSaudi ArabiaSenegalSierra LeoneSingaporeSlovak RepublicSloveniaSolomon IslandsSouth AfricaSpainSri LankaSudanSurinameSwazilandSwedenSwitzerlandSyrian Arab RepublicTajikistanTanzaniaThailandTogoTrinidad and TobagoTunisiaTurkeyUgandaUkraineUnited KingdomUnited StatesUruguayVenezuela, RBVietnamYemen, Rep.ZambiaZimbabwe Timeline:
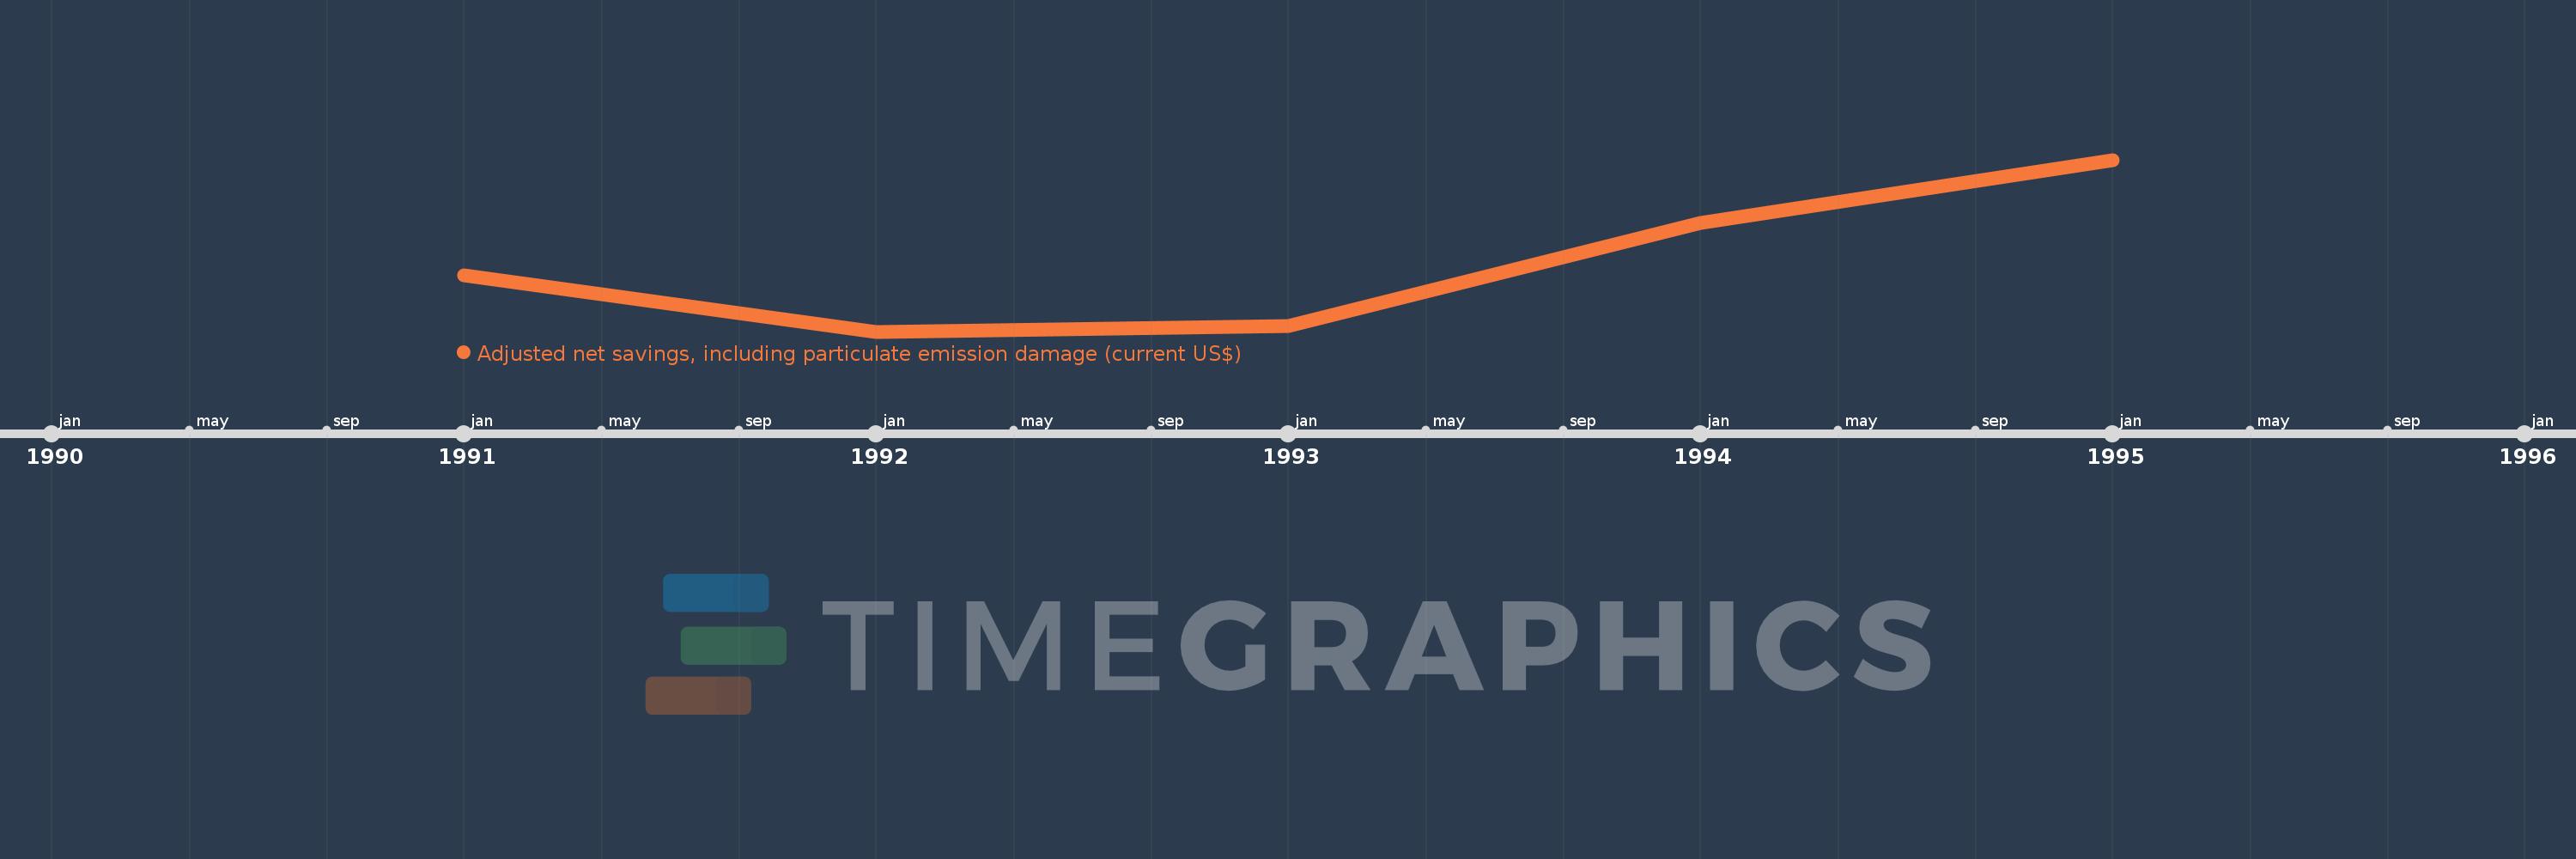
This timeline shows a graph from 1991 to 1995 of Central African Republic. No data until 1990. Number of actual observations by date: 5.
Source name:
World Development Indicators
Source organization:
World Bank staff estimates based on sources and methods in World Bank's "The Changing Wealth of Nations: Measuring Sustainable Development in the New Millennium" (2011).
Categories, topics:
Economy & Growth, Environment
Last updated:
apr 23, 2017
Indicators value changes by year
Minimum:
-2.557 mln
jan 1, 1992
Maximum:
45.487 mln
jan 1, 1995
At the date of observation
Value
Absolute change
Change from the previous value
jan 1, 1991
13.185 mln
+13.185 mln
0.0%
jan 1, 1992
-2.557 mln
-15.742 mln
-119.39%
jan 1, 1993
-1.061 mln
+1.496 mln
-58.51%
jan 1, 1994
27.814 mln
+28.875 mln
-2.72K%
jan 1, 1995
45.487 mln
+17.673 mln
63.54%
Ranking of countries by current statistics by years