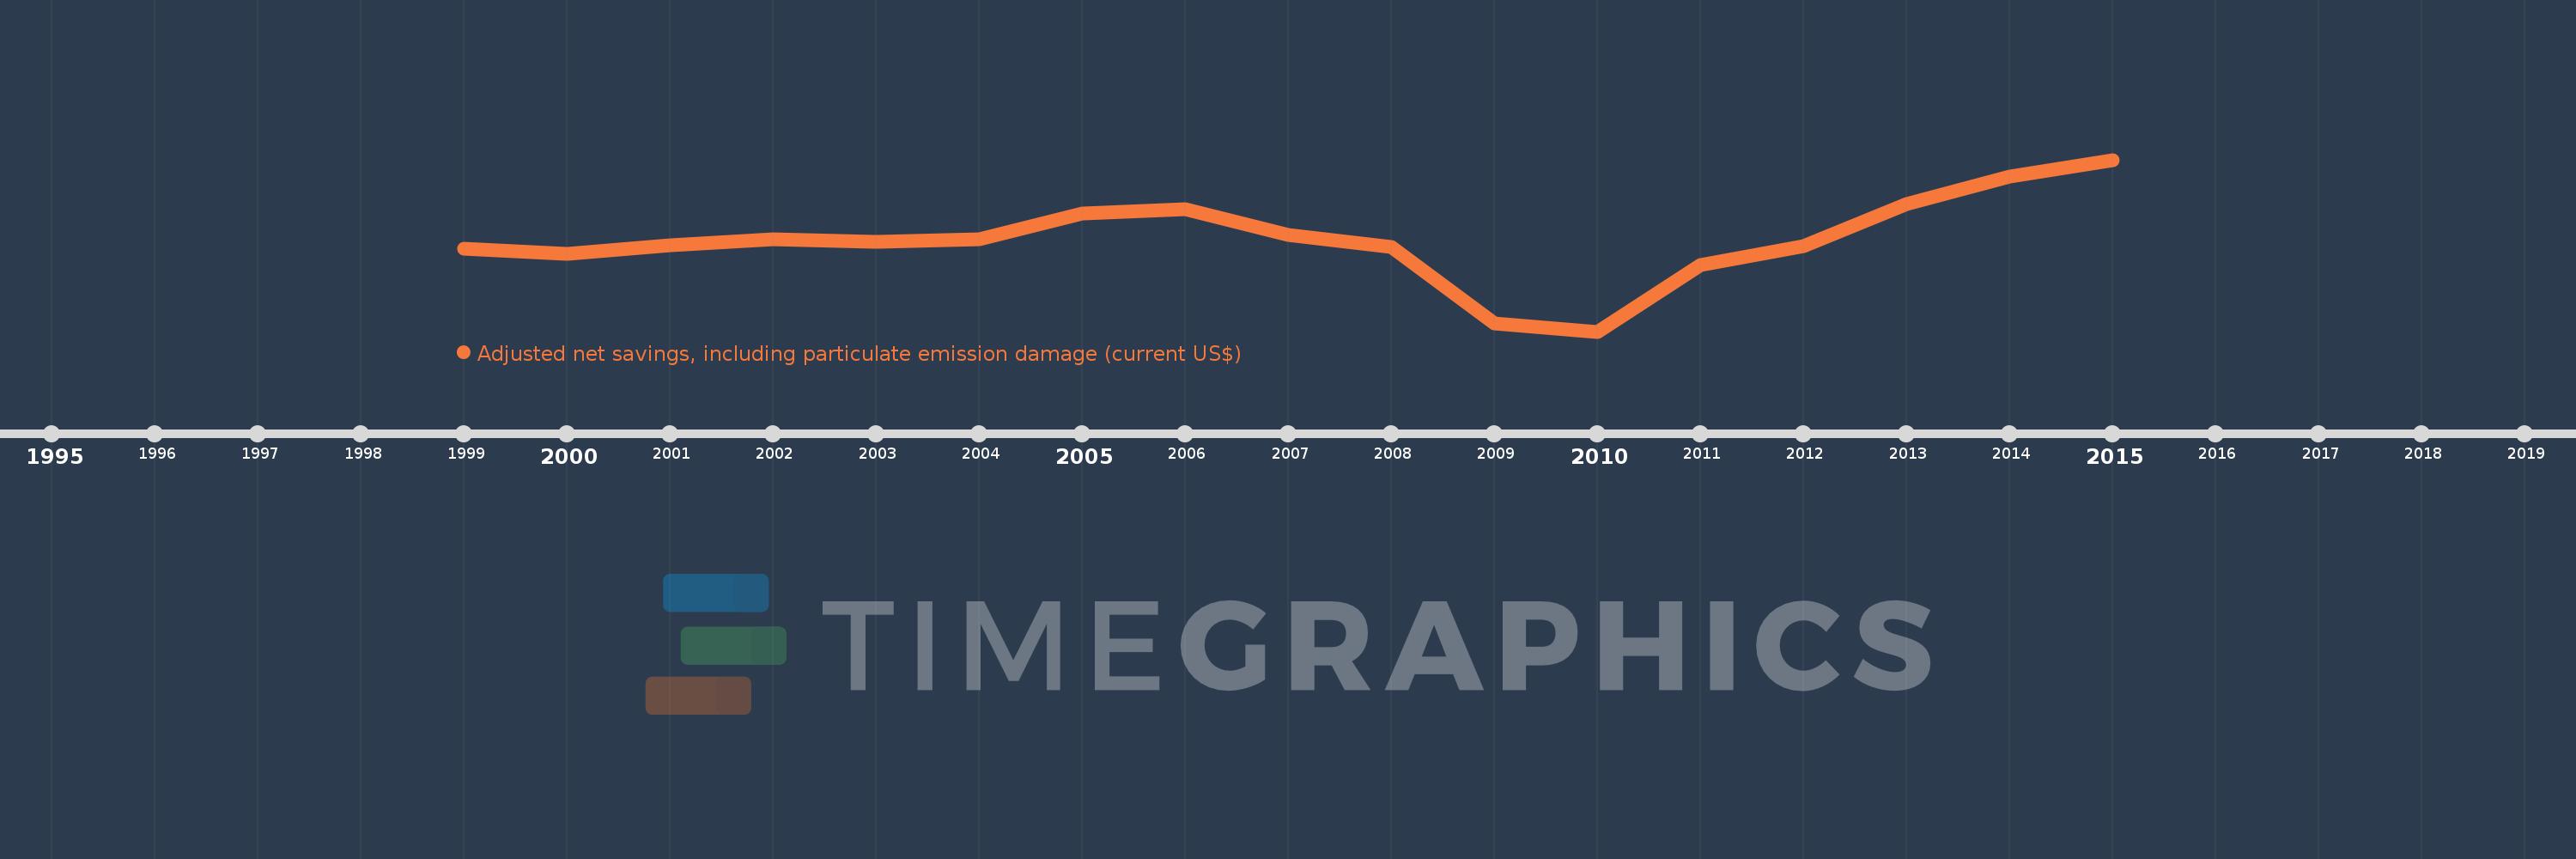
This timeline shows a graph from 1999 to 2015 of Georgia. No data until 1998. Number of actual observations by date: 17.
Source name:
World Development Indicators
Source organization:
World Bank staff estimates based on sources and methods in World Bank's "The Changing Wealth of Nations: Measuring Sustainable Development in the New Millennium" (2011).
Categories, topics:
Economy & Growth, Environment
Last updated:
apr 23, 2017
Indicators value changes by year
Meaning:
463.928 mln
Minimum:
-754.433 mln
jan 1, 2010
Maximum:
1.532 bln
jan 1, 2015
At the date of observation
Value
Absolute change
Change from the previous value
jan 1, 1999
346.866 mln
+346.866 mln
0.0%
jan 1, 2000
275.008 mln
-71.858 mln
-20.72%
jan 1, 2001
390.927 mln
+115.919 mln
42.15%
jan 1, 2002
477.833 mln
+86.906 mln
22.23%
jan 1, 2003
434.977 mln
-42.856 mln
-8.97%
jan 1, 2004
470.615 mln
+35.638 mln
8.19%
jan 1, 2005
820.116 mln
+349.501 mln
74.26%
jan 1, 2006
874.825 mln
+54.709 mln
6.67%
jan 1, 2007
529.982 mln
-344.842 mln
-39.42%
jan 1, 2008
375.861 mln
-154.121 mln
-29.08%
jan 1, 2009
-645.405 mln
-1.021 bln
-271.71%
jan 1, 2010
-754.433 mln
-109.028 mln
16.89%
jan 1, 2011
126.147 mln
+880.58 mln
-116.72%
jan 1, 2012
385.779 mln
+259.632 mln
205.82%
jan 1, 2013
940.68 mln
+554.901 mln
143.84%
jan 1, 2014
1.305 bln
+364.06 mln
38.7%
jan 1, 2015
1.532 bln
+227.526 mln
17.44%
Ranking of countries by current statistics by years