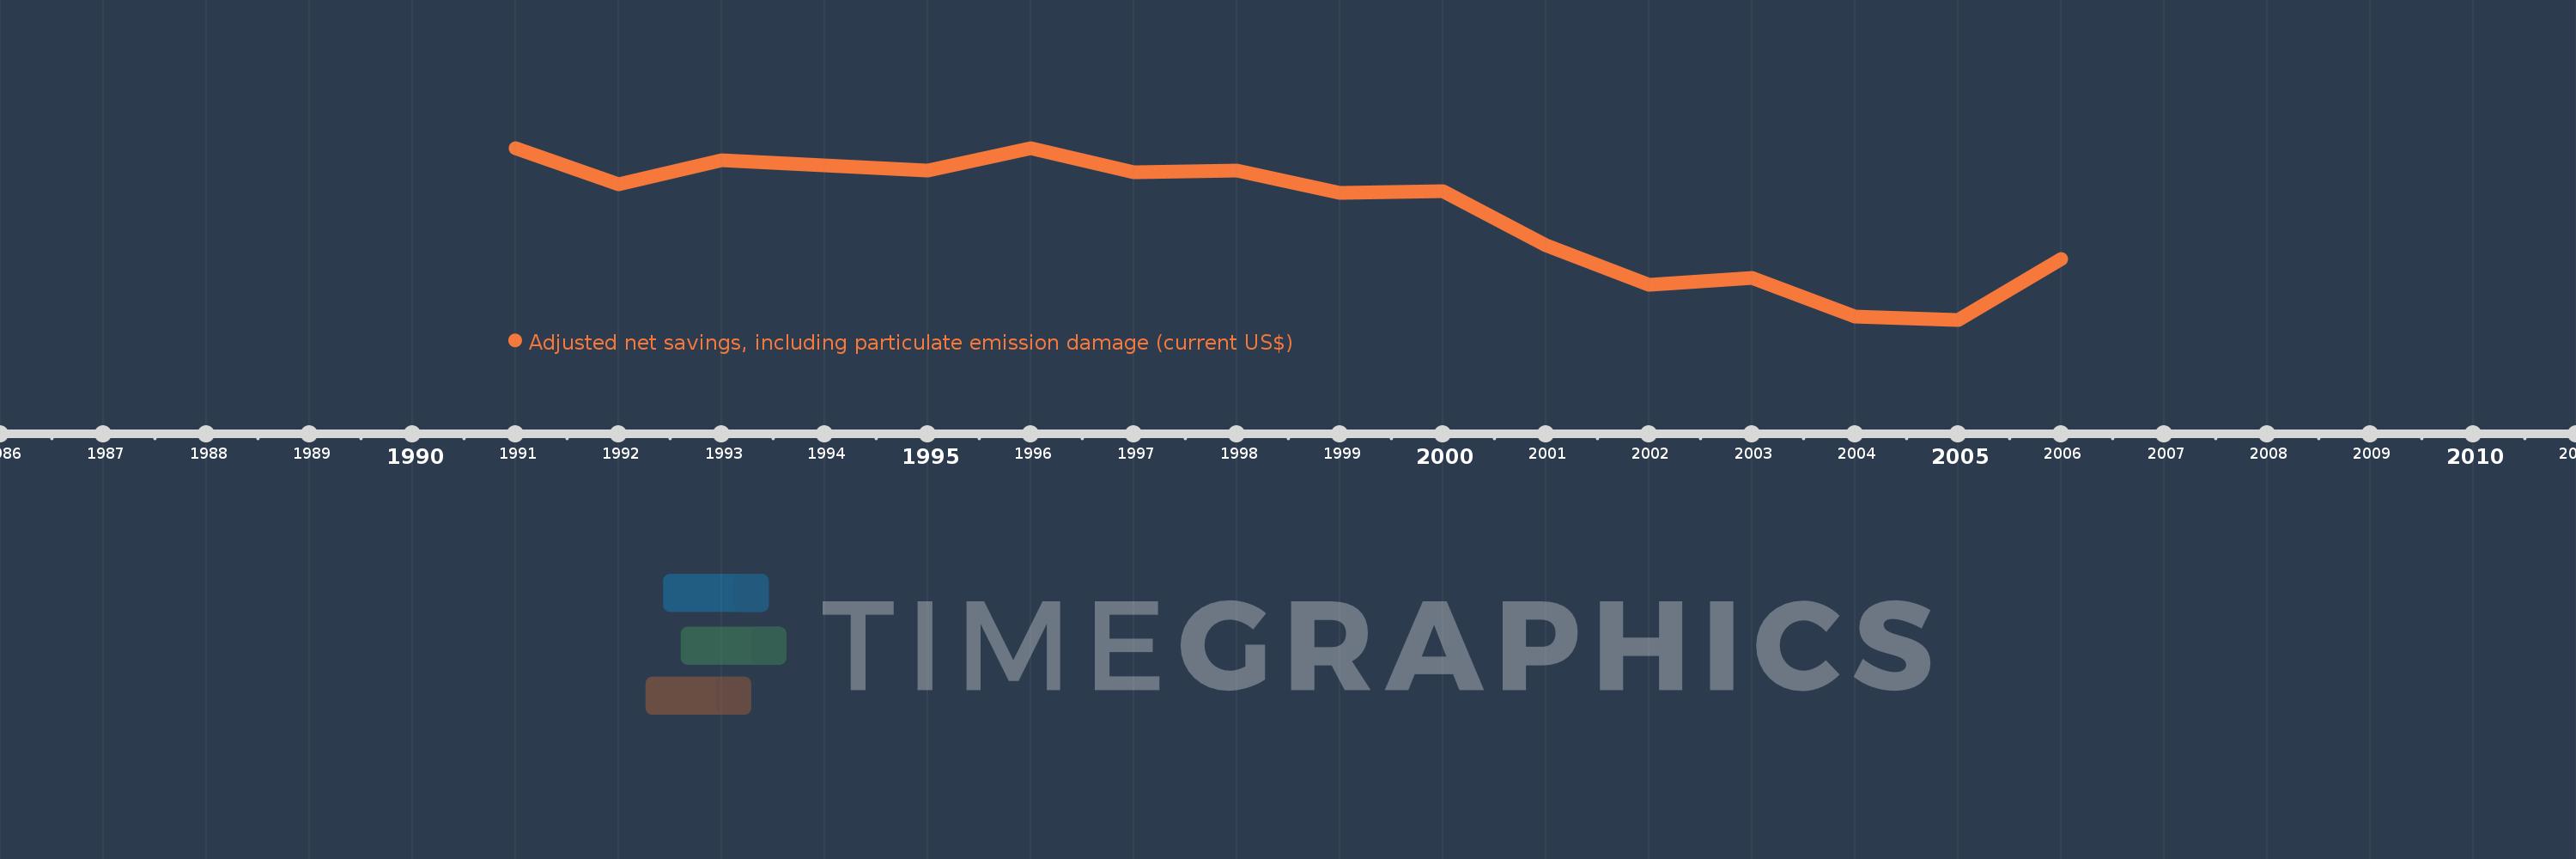
This timeline shows a graph from 1991 to 2006 of Suriname. No data until 1990. Number of actual observations by date: 15.
Source name:
World Development Indicators
Source organization:
World Bank staff estimates based on sources and methods in World Bank's "The Changing Wealth of Nations: Measuring Sustainable Development in the New Millennium" (2011).
Categories, topics:
Economy & Growth, Environment
Last updated:
apr 23, 2017
Indicators value changes by year
Meaning:
-130.036 mln
Minimum:
-328.123 mln
jan 1, 2005
Maximum:
-205.426K
jan 1, 1991
At the date of observation
Value
Absolute change
Change from the previous value
jan 1, 1991
-205.426K
-205.426K
0.0%
jan 1, 1992
-69.334 mln
-69.129 mln
33.65K%
jan 1, 1993
-23.418 mln
+45.916 mln
-66.22%
jan 1, 1995
-42.704 mln
-19.285 mln
82.35%
jan 1, 1996
-1.01 mln
+41.694 mln
-97.64%
jan 1, 1997
-46.471 mln
-45.461 mln
4.5K%
jan 1, 1998
-43.009 mln
+3.462 mln
-7.45%
jan 1, 1999
-85.145 mln
-42.136 mln
97.97%
jan 1, 2000
-82.193 mln
+2.952 mln
-3.47%
jan 1, 2001
-185.413 mln
-103.22 mln
125.58%
jan 1, 2002
-260.771 mln
-75.358 mln
40.64%
jan 1, 2003
-248.501 mln
+12.27 mln
-4.71%
jan 1, 2004
-321.94 mln
-73.439 mln
29.55%
jan 1, 2005
-328.123 mln
-6.183 mln
1.92%
jan 1, 2006
-212.297 mln
+115.826 mln
-35.3%
Ranking of countries by current statistics by years