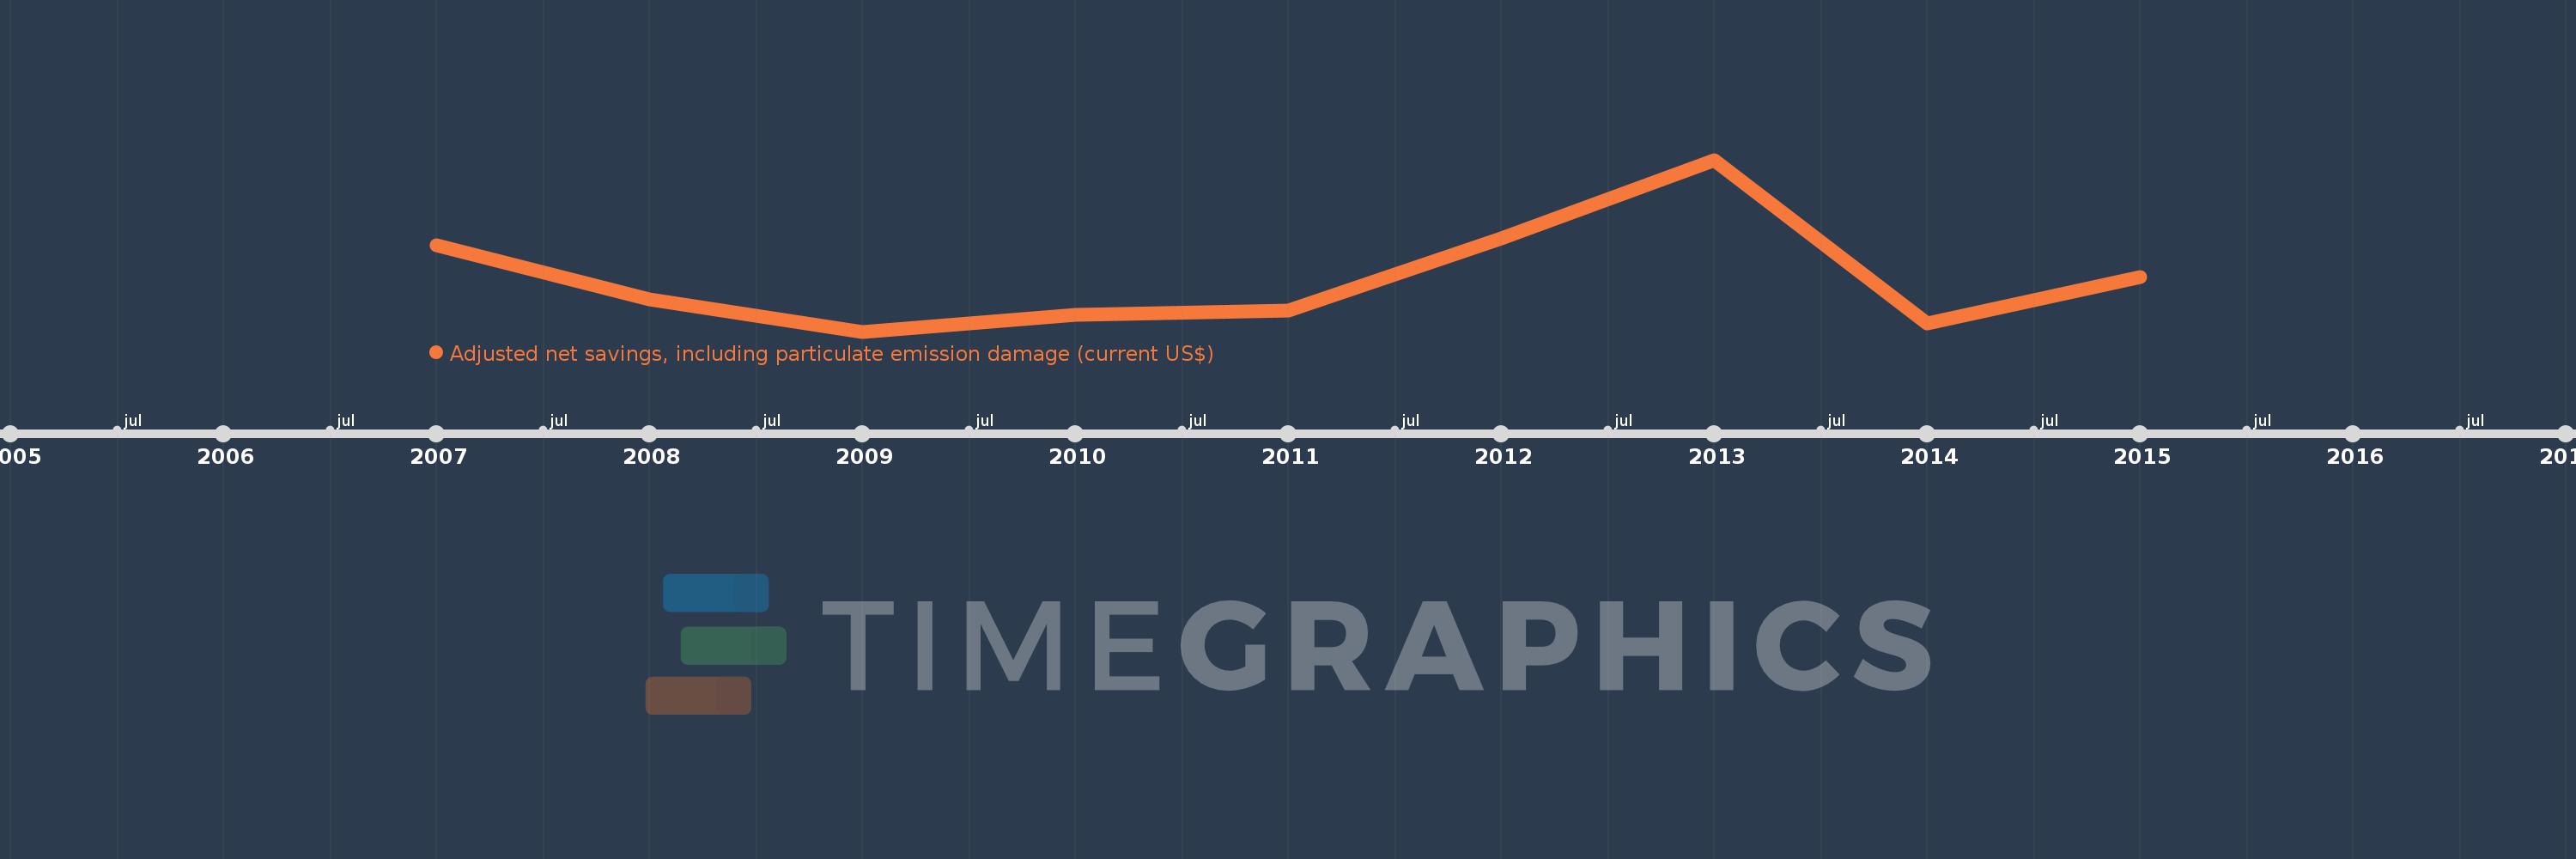
This timeline shows a graph from 2007 to 2015 of Bhutan. No data until 2006. Number of actual observations by date: 9.
Source name:
World Development Indicators
Source organization:
World Bank staff estimates based on sources and methods in World Bank's "The Changing Wealth of Nations: Measuring Sustainable Development in the New Millennium" (2011).
Categories, topics:
Economy & Growth, Environment
Last updated:
apr 23, 2017
Indicators value changes by year
Meaning:
266.934 mln
Minimum:
142.33 mln
jan 1, 2009
Maximum:
541.33 mln
jan 1, 2013
At the date of observation
Value
Absolute change
Change from the previous value
jan 1, 2007
342.322 mln
+342.322 mln
0.0%
jan 1, 2008
216.51 mln
-125.812 mln
-36.75%
jan 1, 2009
142.33 mln
-74.18 mln
-34.26%
jan 1, 2010
180.905 mln
+38.576 mln
27.1%
jan 1, 2011
191.815 mln
+10.91 mln
6.03%
jan 1, 2012
358.2 mln
+166.385 mln
86.74%
jan 1, 2013
541.33 mln
+183.13 mln
51.12%
jan 1, 2014
160.661 mln
-380.669 mln
-70.32%
jan 1, 2015
268.33 mln
+107.668 mln
67.02%
Ranking of countries by current statistics by years