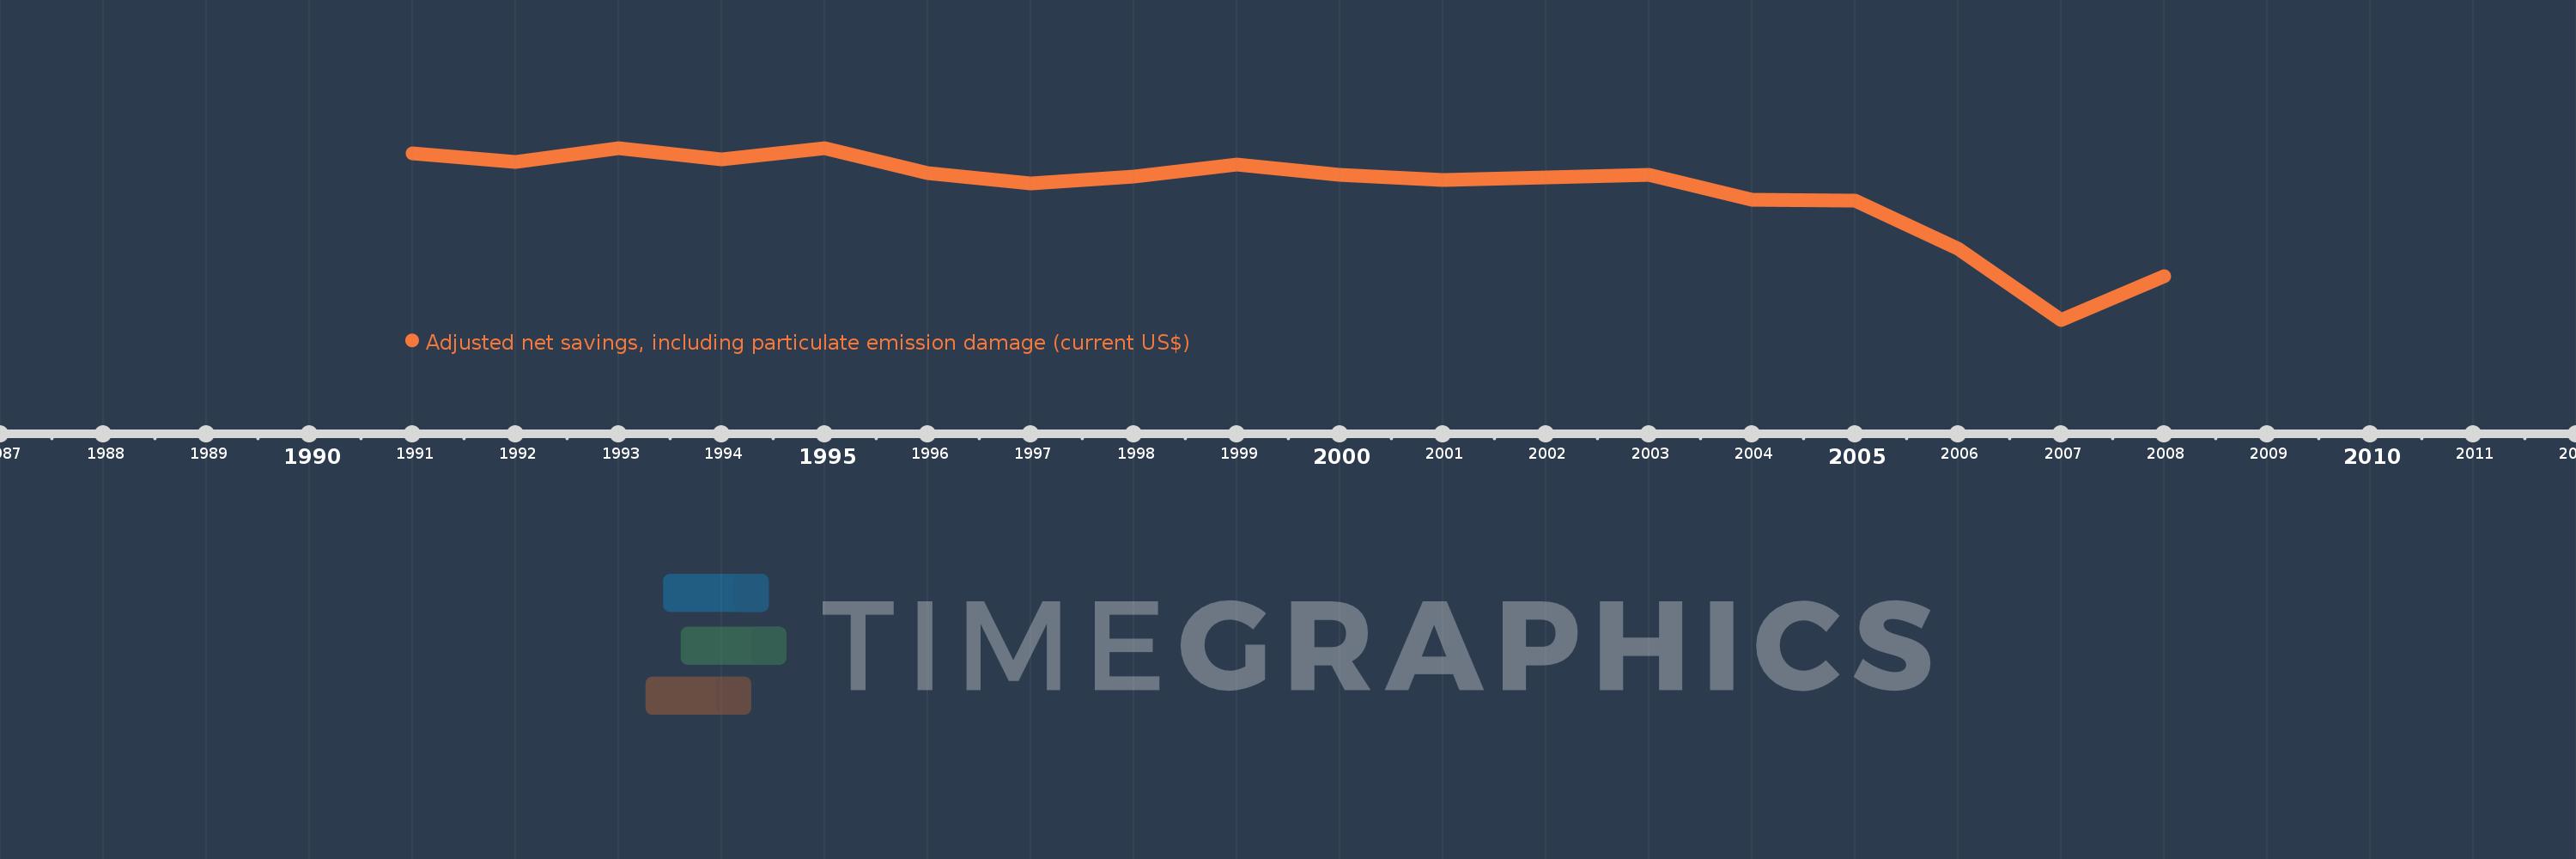
This timeline shows a graph from 1991 to 2008 of Congo, Rep.. No data until 1990. Number of actual observations by date: 18.
Source name:
World Development Indicators
Source organization:
World Bank staff estimates based on sources and methods in World Bank's "The Changing Wealth of Nations: Measuring Sustainable Development in the New Millennium" (2011).
Categories, topics:
Economy & Growth, Environment
Last updated:
apr 23, 2017
Indicators value changes by year
Meaning:
-1.552 bln
Minimum:
-5.289 bln
jan 1, 2007
Maximum:
-341.707 mln
jan 1, 1993
At the date of observation
Value
Absolute change
Change from the previous value
jan 1, 1991
-487.006 mln
-487.006 mln
0.0%
jan 1, 1992
-745.613 mln
-258.607 mln
53.1%
jan 1, 1993
-341.707 mln
+403.905 mln
-54.17%
jan 1, 1994
-676.922 mln
-335.215 mln
98.1%
jan 1, 1995
-350.971 mln
+325.951 mln
-48.15%
jan 1, 1996
-1.076 bln
-725.464 mln
206.7%
jan 1, 1997
-1.358 bln
-281.192 mln
26.12%
jan 1, 1998
-1.157 bln
+201.09 mln
-14.81%
jan 1, 1999
-824.546 mln
+331.991 mln
-28.71%
jan 1, 2000
-1.11 bln
-285.168 mln
34.58%
jan 1, 2001
-1.259 bln
-149.448 mln
13.47%
jan 1, 2002
-1.192 bln
+66.674 mln
-5.3%
jan 1, 2003
-1.109 bln
+83.11 mln
-6.97%
jan 1, 2004
-1.833 bln
-724.058 mln
65.27%
jan 1, 2005
-1.869 bln
-35.29 mln
1.92%
jan 1, 2006
-3.232 bln
-1.363 bln
72.95%
jan 1, 2007
-5.289 bln
-2.057 bln
63.65%
jan 1, 2008
-4.029 bln
+1.26 bln
-23.82%
Ranking of countries by current statistics by years