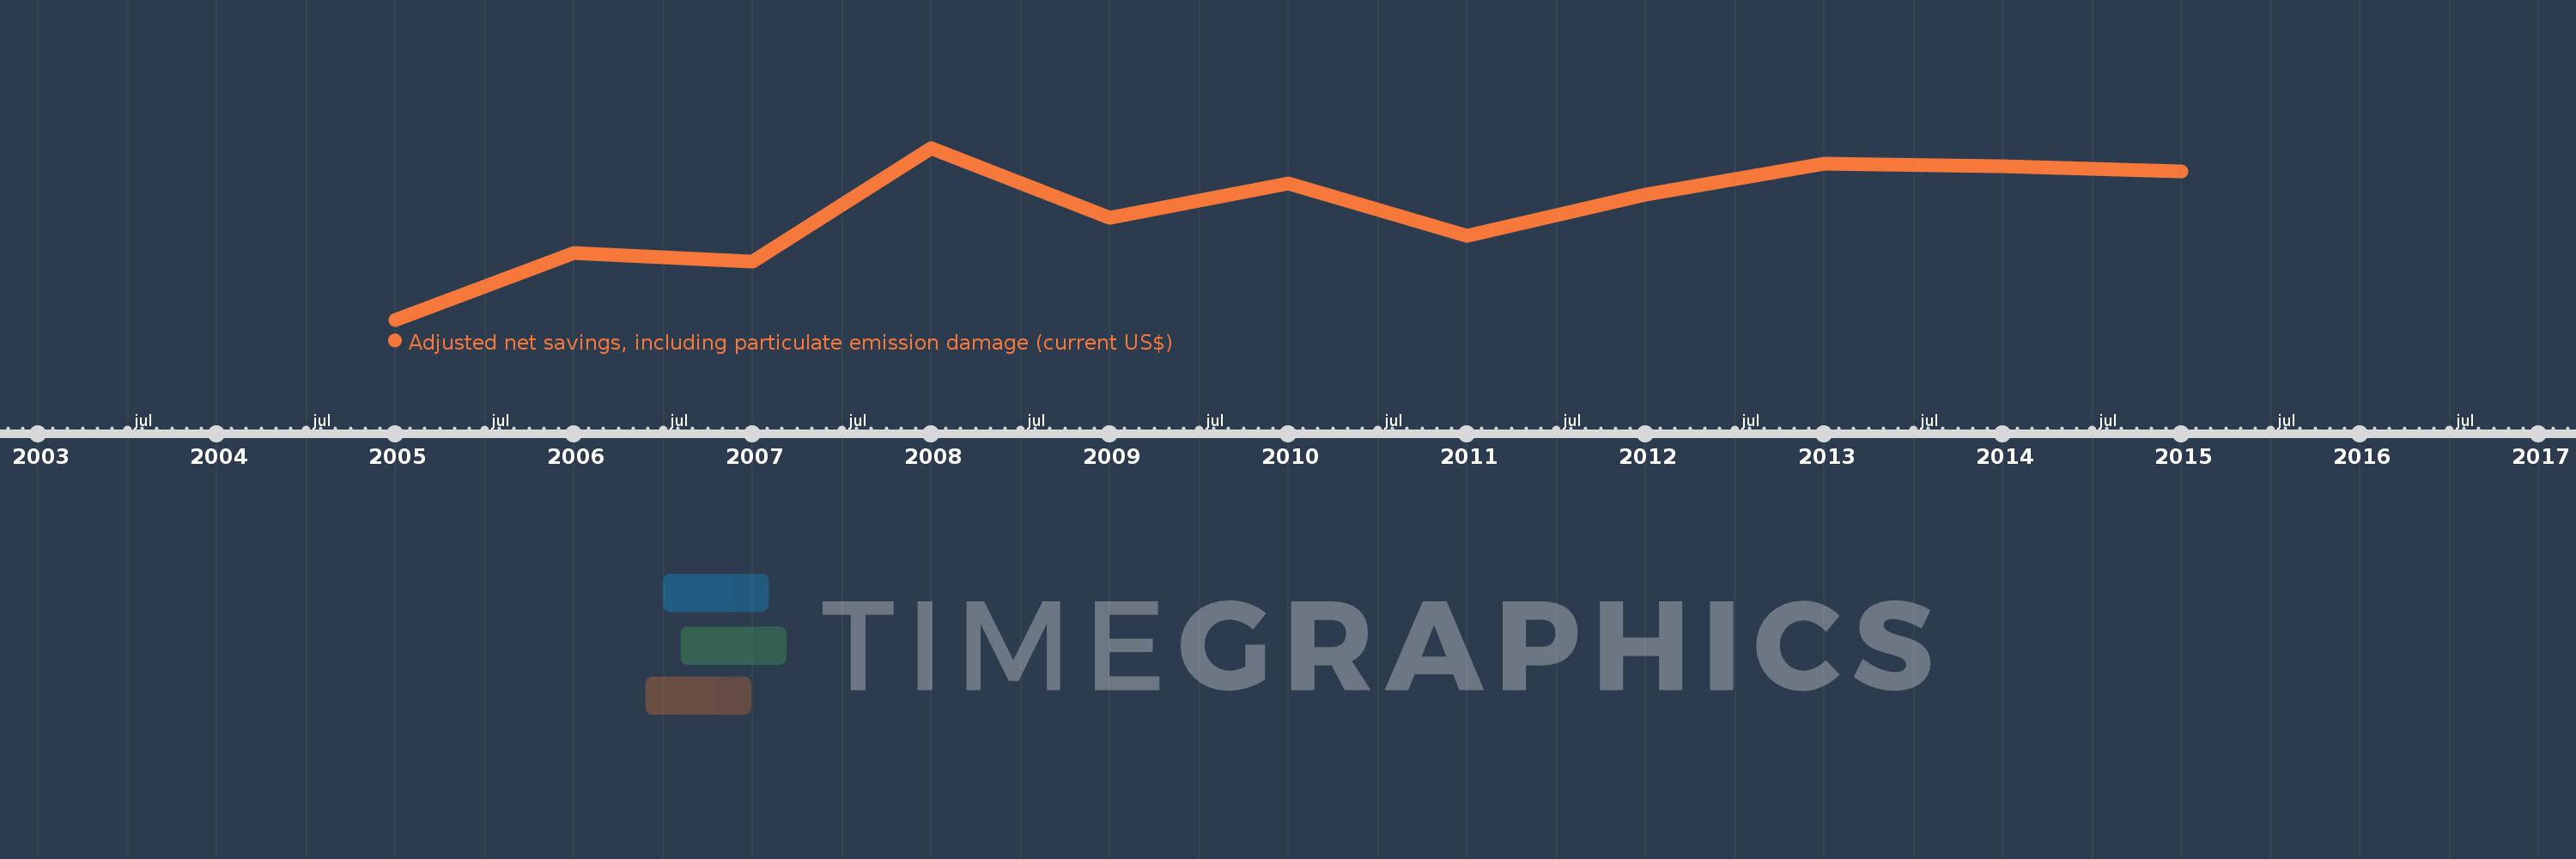
This timeline shows a graph from 2005 to 2015 of Haiti. No data until 2004. Number of actual observations by date: 11.
Source name:
World Development Indicators
Source organization:
World Bank staff estimates based on sources and methods in World Bank's "The Changing Wealth of Nations: Measuring Sustainable Development in the New Millennium" (2011).
Categories, topics:
Economy & Growth, Environment
Last updated:
apr 23, 2017
Indicators value changes by year
Meaning:
1.293 bln
Minimum:
864.279 mln
jan 1, 2005
Maximum:
1.539 bln
jan 1, 2008
At the date of observation
Value
Absolute change
Change from the previous value
jan 1, 2005
864.279 mln
+864.279 mln
0.0%
jan 1, 2006
1.125 bln
+260.903 mln
30.19%
jan 1, 2007
1.094 bln
-31.329 mln
-2.78%
jan 1, 2008
1.539 bln
+445.502 mln
40.73%
jan 1, 2009
1.264 bln
-275.239 mln
-17.88%
jan 1, 2010
1.4 bln
+136.25 mln
10.78%
jan 1, 2011
1.193 bln
-207.029 mln
-14.78%
jan 1, 2012
1.357 bln
+163.278 mln
13.68%
jan 1, 2013
1.476 bln
+119.287 mln
8.79%
jan 1, 2014
1.468 bln
-7.986 mln
-0.54%
jan 1, 2015
1.446 bln
-22.365 mln
-1.52%
Ranking of countries by current statistics by years