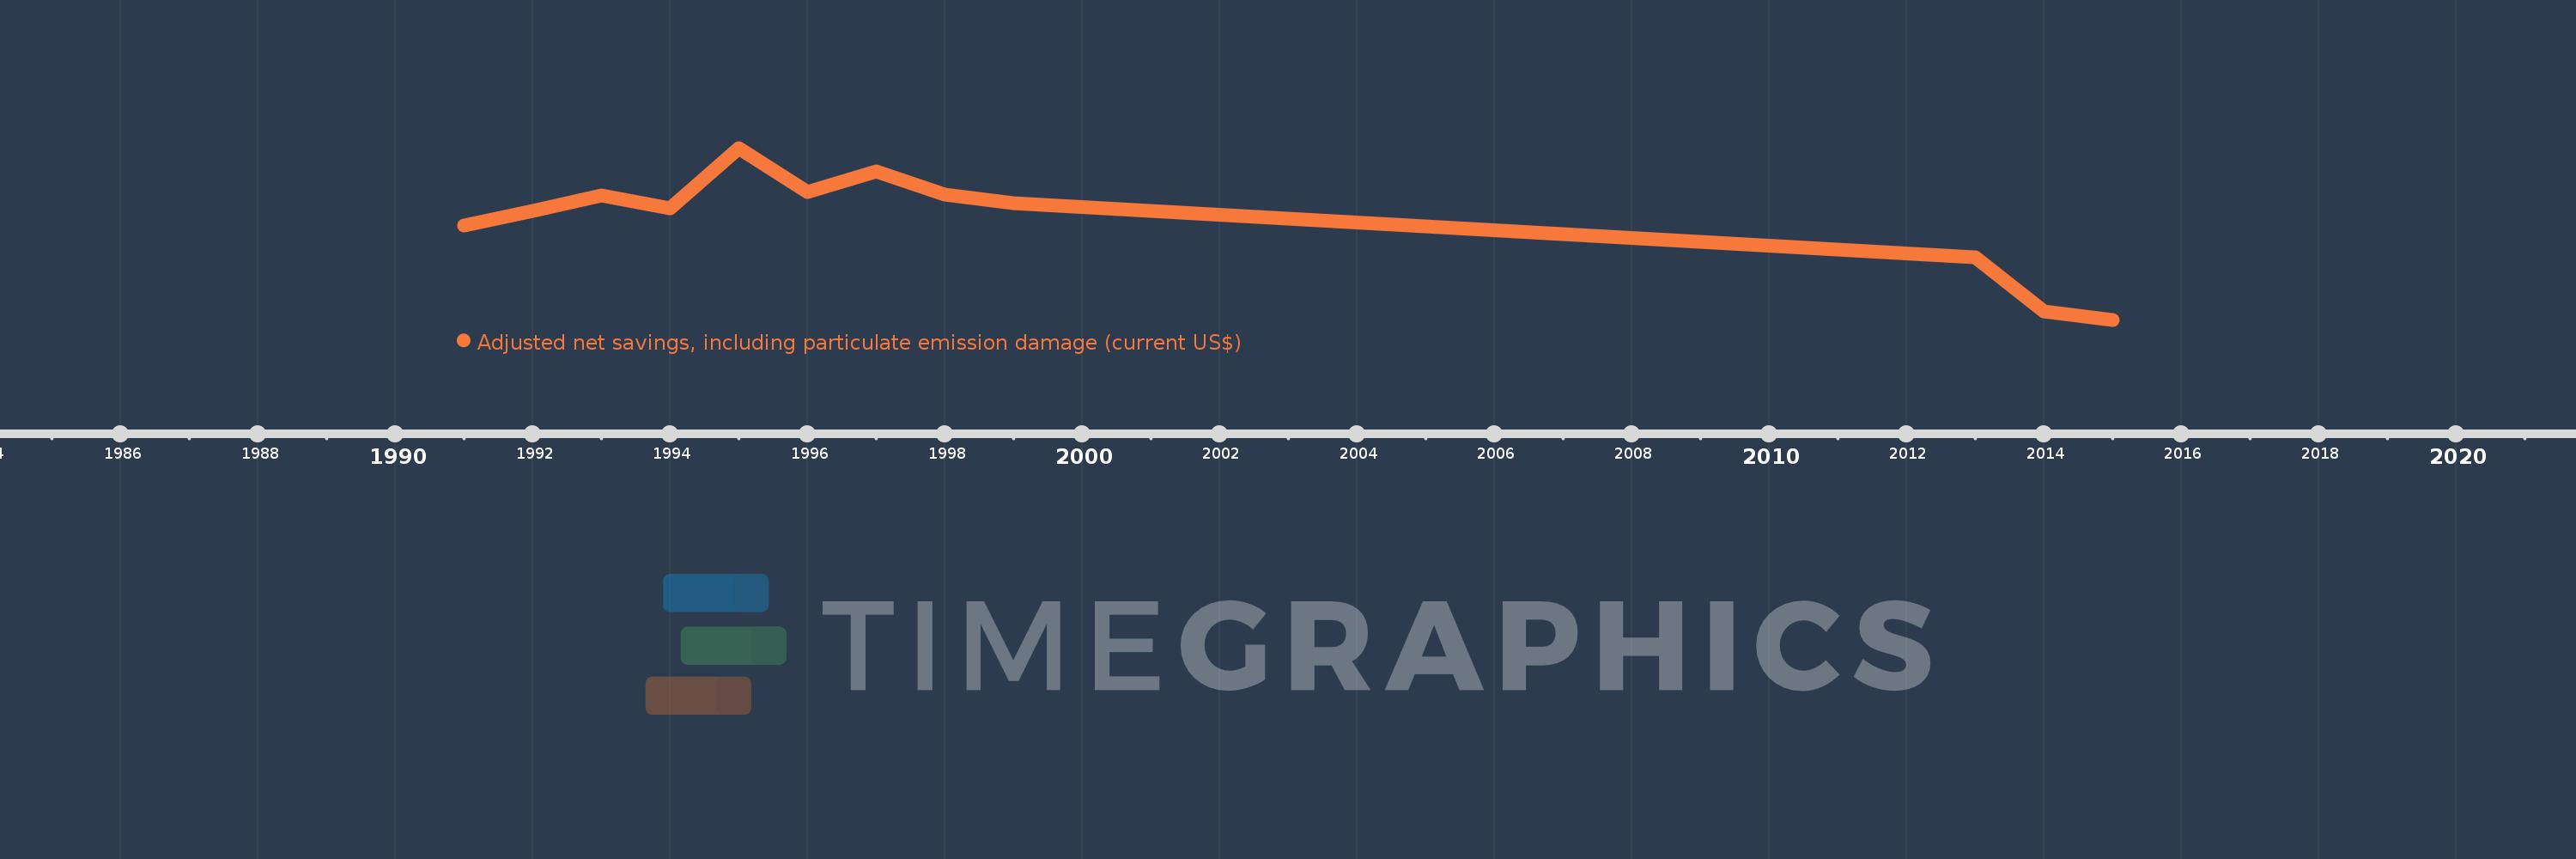
This timeline shows a graph from 1991 to 2015 of Mauritania. No data until 1990. Number of actual observations by date: 12.
Source name:
World Development Indicators
Source organization:
World Bank staff estimates based on sources and methods in World Bank's "The Changing Wealth of Nations: Measuring Sustainable Development in the New Millennium" (2011).
Categories, topics:
Economy & Growth, Environment
Last updated:
apr 23, 2017
Indicators value changes by year
Meaning:
-22.86 mln
Minimum:
-815.043 mln
jan 1, 2015
Maximum:
546.349 mln
jan 1, 1995
At the date of observation
Value
Absolute change
Change from the previous value
jan 1, 1991
-66.306 mln
-66.306 mln
0.0%
jan 1, 1992
46.614 mln
+112.92 mln
-170.3%
jan 1, 1993
170.613 mln
+123.998 mln
266.01%
jan 1, 1994
70.868 mln
-99.745 mln
-58.46%
jan 1, 1995
546.349 mln
+475.482 mln
670.94%
jan 1, 1996
198.232 mln
-348.117 mln
-63.72%
jan 1, 1997
358.549 mln
+160.317 mln
80.87%
jan 1, 1998
174.954 mln
-183.595 mln
-51.21%
jan 1, 1999
105.668 mln
-69.285 mln
-39.6%
jan 1, 2013
-317.145 mln
-422.813 mln
-400.13%
jan 1, 2014
-747.674 mln
-430.529 mln
135.75%
jan 1, 2015
-815.043 mln
-67.37 mln
9.01%
Ranking of countries by current statistics by years