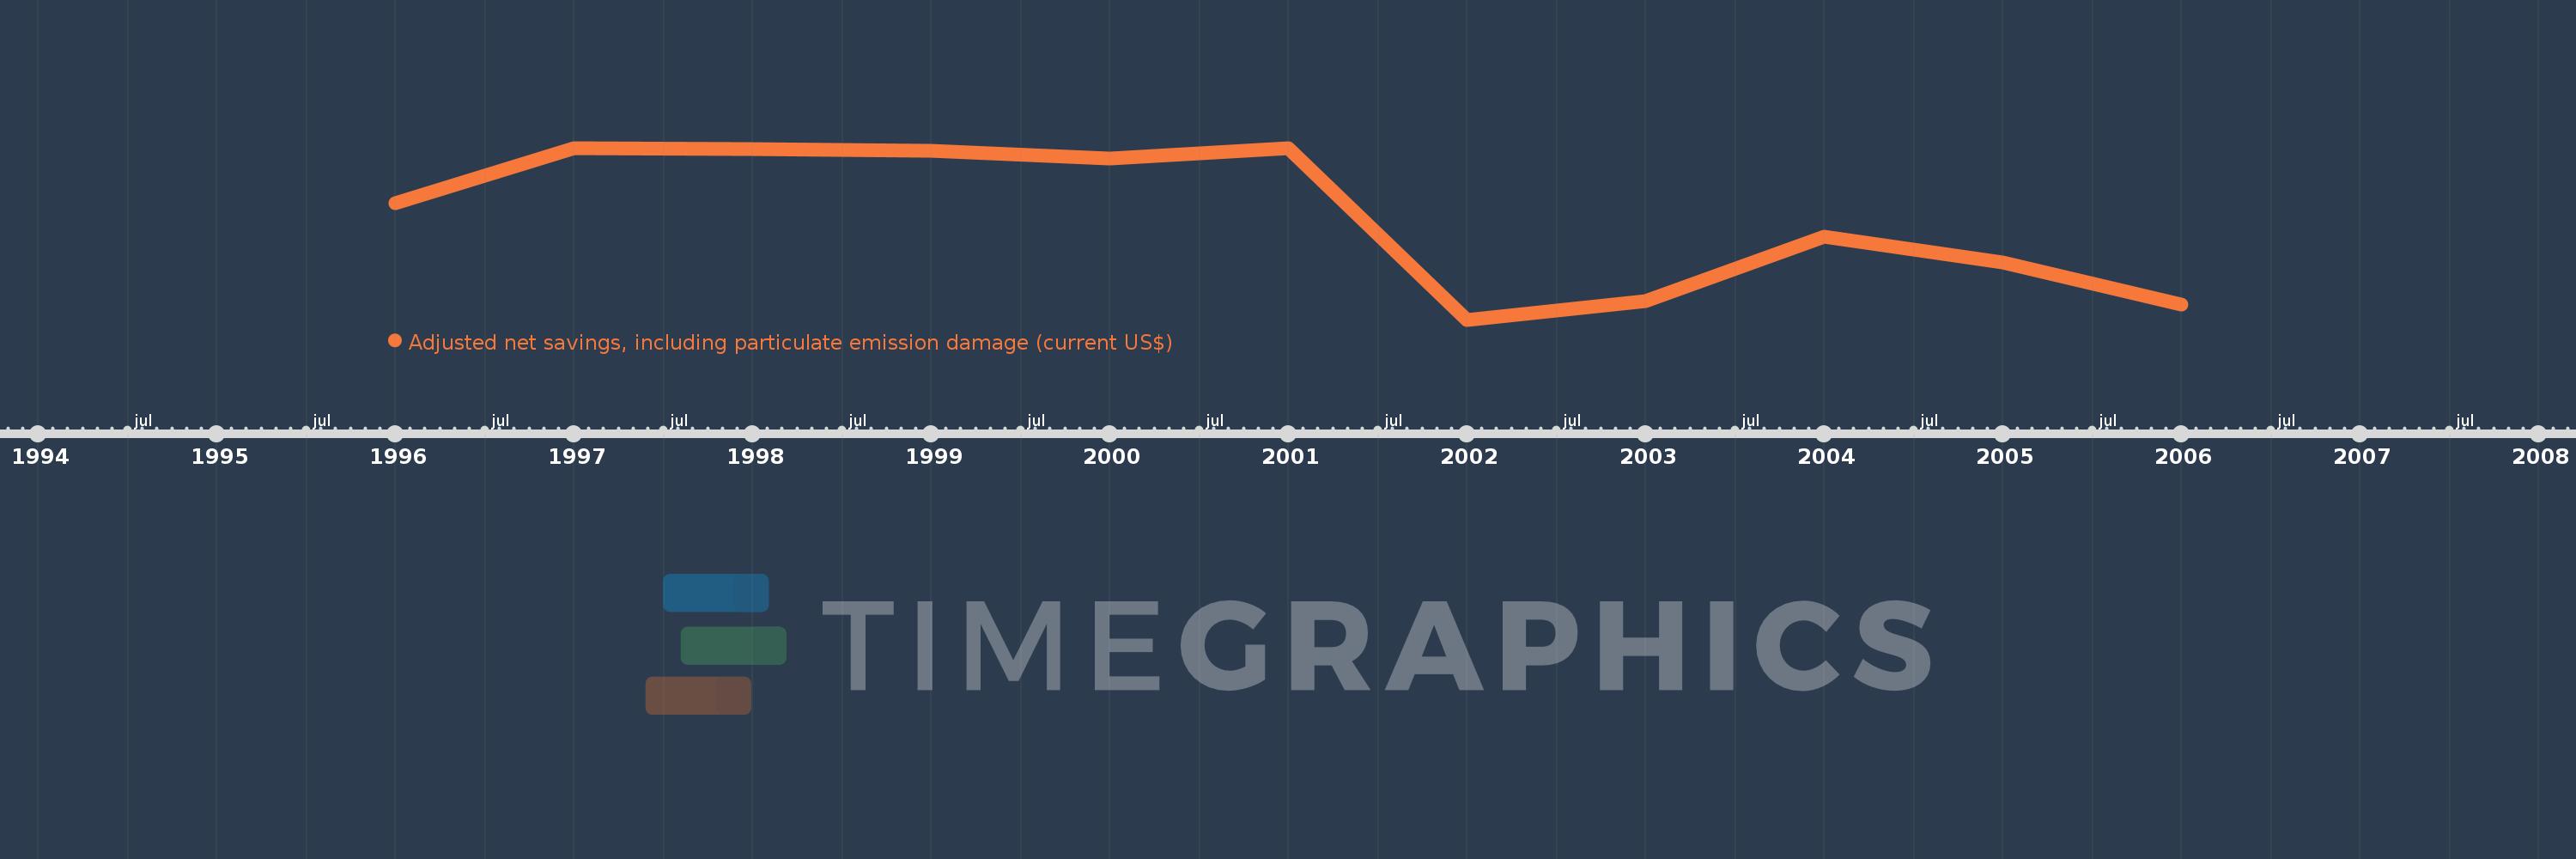
This timeline shows a graph from 1996 to 2006 of Maldives. No data until 1995. Number of actual observations by date: 11.
Source name:
World Development Indicators
Source organization:
World Bank staff estimates based on sources and methods in World Bank's "The Changing Wealth of Nations: Measuring Sustainable Development in the New Millennium" (2011).
Categories, topics:
Economy & Growth, Environment
Last updated:
apr 23, 2017
Indicators value changes by year
Meaning:
150.754 mln
Minimum:
82.943 mln
jan 1, 2002
Maximum:
195.801 mln
jan 1, 2001
At the date of observation
Value
Absolute change
Change from the previous value
jan 1, 1996
159.644 mln
+159.644 mln
0.0%
jan 1, 1997
195.394 mln
+35.75 mln
22.39%
jan 1, 1998
195.239 mln
-155.555K
-0.08%
jan 1, 1999
193.922 mln
-1.317 mln
-0.67%
jan 1, 2000
188.701 mln
-5.221 mln
-2.69%
jan 1, 2001
195.801 mln
+7.1 mln
3.76%
jan 1, 2002
82.943 mln
-112.858 mln
-57.64%
jan 1, 2003
95.157 mln
+12.214 mln
14.73%
jan 1, 2004
137.665 mln
+42.508 mln
44.67%
jan 1, 2005
120.632 mln
-17.033 mln
-12.37%
jan 1, 2006
93.196 mln
-27.436 mln
-22.74%
Ranking of countries by current statistics by years