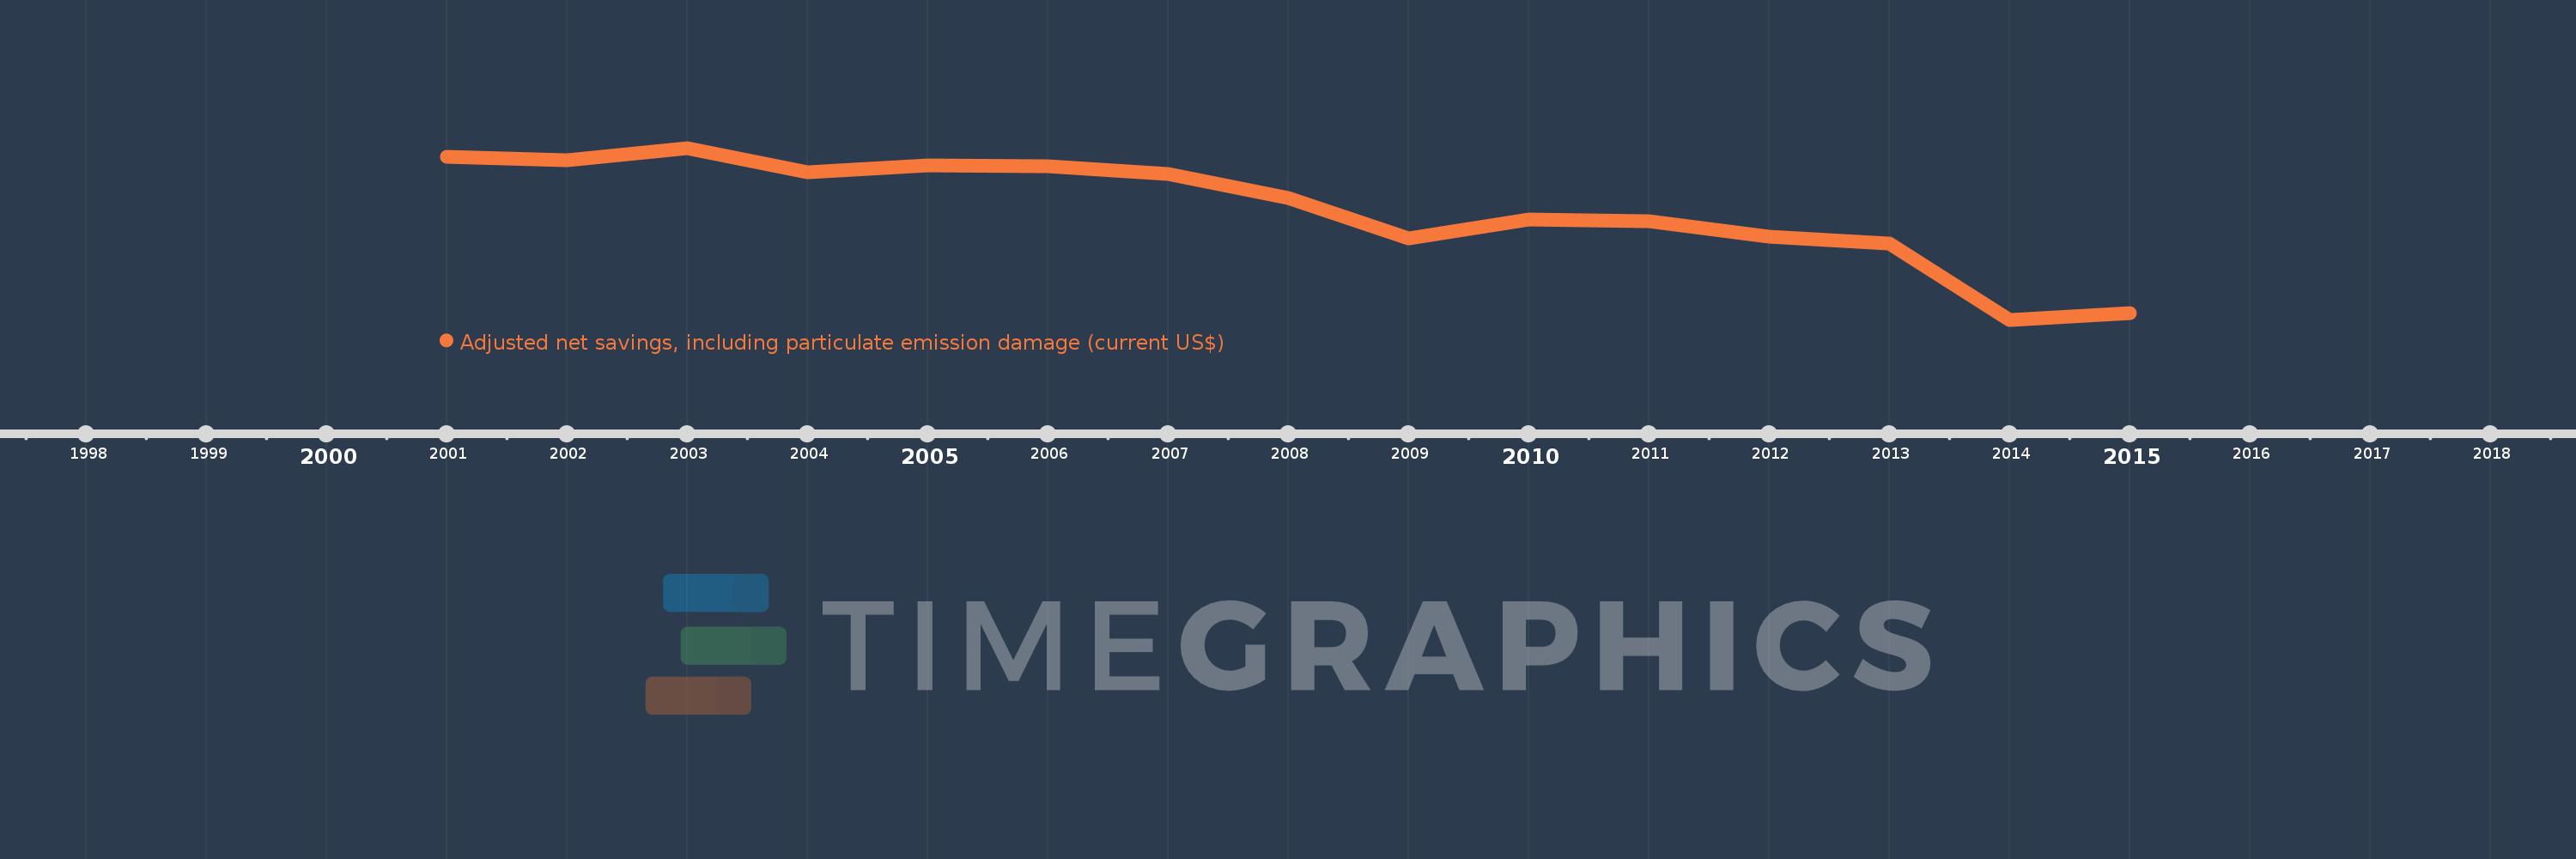
This timeline shows a graph from 2001 to 2015 of Congo, Dem. Rep.. No data until 2000. Number of actual observations by date: 15.
Source name:
World Development Indicators
Source organization:
World Bank staff estimates based on sources and methods in World Bank's "The Changing Wealth of Nations: Measuring Sustainable Development in the New Millennium" (2011).
Categories, topics:
Economy & Growth, Environment
Last updated:
apr 23, 2017
Indicators value changes by year
Meaning:
-3.129 bln
Minimum:
-7.996 bln
jan 1, 2014
Maximum:
-444.872 mln
jan 1, 2003
At the date of observation
Value
Absolute change
Change from the previous value
jan 1, 2001
-843.109 mln
-843.109 mln
0.0%
jan 1, 2002
-994.06 mln
-150.951 mln
17.9%
jan 1, 2003
-444.872 mln
+549.188 mln
-55.25%
jan 1, 2004
-1.526 bln
-1.081 bln
243.05%
jan 1, 2005
-1.227 bln
+298.742 mln
-19.58%
jan 1, 2006
-1.258 bln
-31.085 mln
2.53%
jan 1, 2007
-1.595 bln
-336.533 mln
26.74%
jan 1, 2008
-2.657 bln
-1.062 bln
66.56%
jan 1, 2009
-4.42 bln
-1.763 bln
66.37%
jan 1, 2010
-3.595 bln
+825.138 mln
-18.67%
jan 1, 2011
-3.679 bln
-84.649 mln
2.35%
jan 1, 2012
-4.335 bln
-655.41 mln
17.81%
jan 1, 2013
-4.655 bln
-319.901 mln
7.38%
jan 1, 2014
-7.996 bln
-3.341 bln
71.78%
jan 1, 2015
-7.713 bln
+282.952 mln
-3.54%
Ranking of countries by current statistics by years