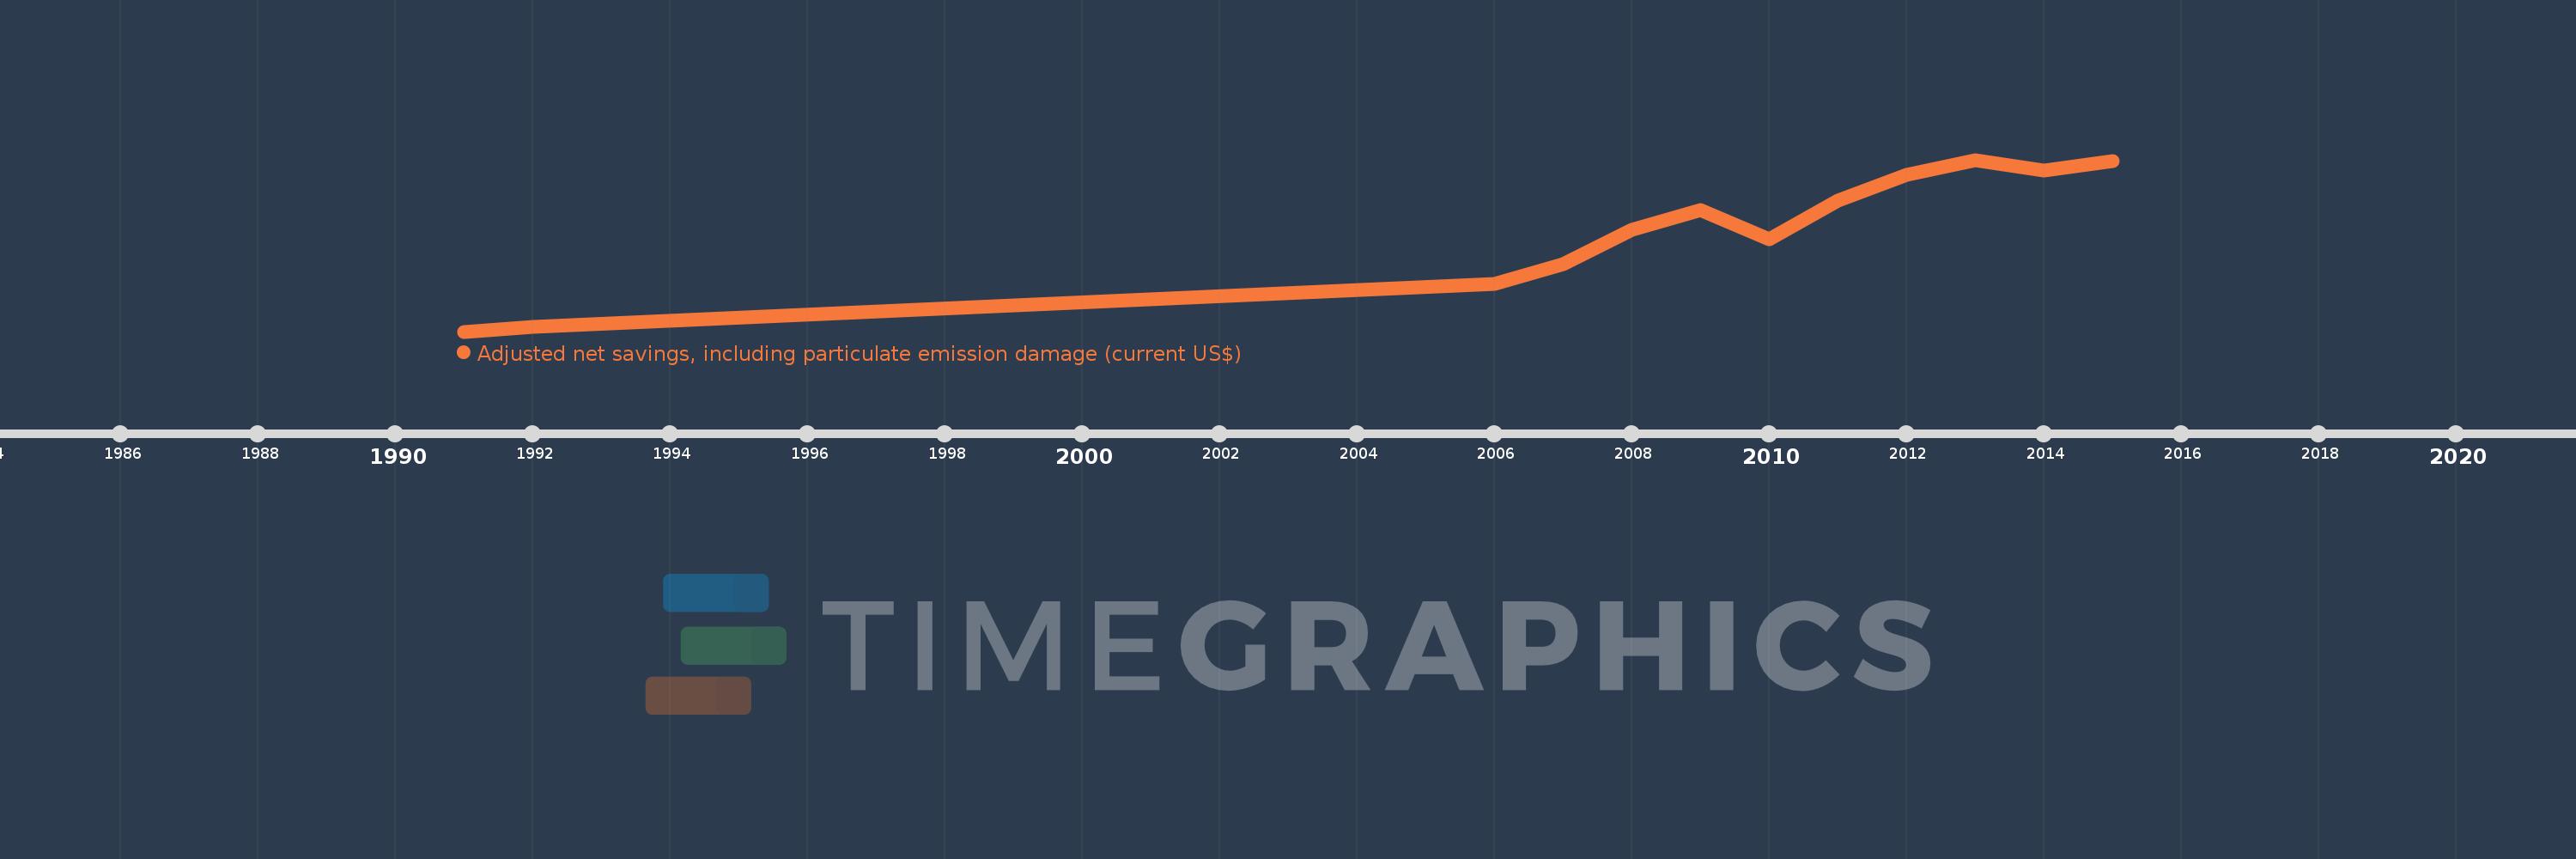
This timeline shows a graph from 1991 to 2015 of Algeria. No data until 1990. Number of actual observations by date: 12.
Source name:
World Development Indicators
Source organization:
World Bank staff estimates based on sources and methods in World Bank's "The Changing Wealth of Nations: Measuring Sustainable Development in the New Millennium" (2011).
Categories, topics:
Economy & Growth, Environment
Last updated:
apr 23, 2017
Indicators value changes by year
Meaning:
35.973 bln
Minimum:
5.927 bln
jan 1, 1991
Maximum:
56.438 bln
jan 1, 2013
At the date of observation
Value
Absolute change
Change from the previous value
jan 1, 1991
5.927 bln
+5.927 bln
0.0%
jan 1, 1992
7.432 bln
+1.505 bln
25.4%
jan 1, 2006
20.013 bln
+12.581 bln
169.28%
jan 1, 2007
25.752 bln
+5.739 bln
28.68%
jan 1, 2008
35.753 bln
+10.0 bln
38.83%
jan 1, 2009
41.635 bln
+5.882 bln
16.45%
jan 1, 2010
32.989 bln
-8.645 bln
-20.76%
jan 1, 2011
44.319 bln
+11.329 bln
34.34%
jan 1, 2012
52.043 bln
+7.725 bln
17.43%
jan 1, 2013
56.438 bln
+4.395 bln
8.44%
jan 1, 2014
53.261 bln
-3.177 bln
-5.63%
jan 1, 2015
56.12 bln
+2.859 bln
5.37%
Ranking of countries by current statistics by years