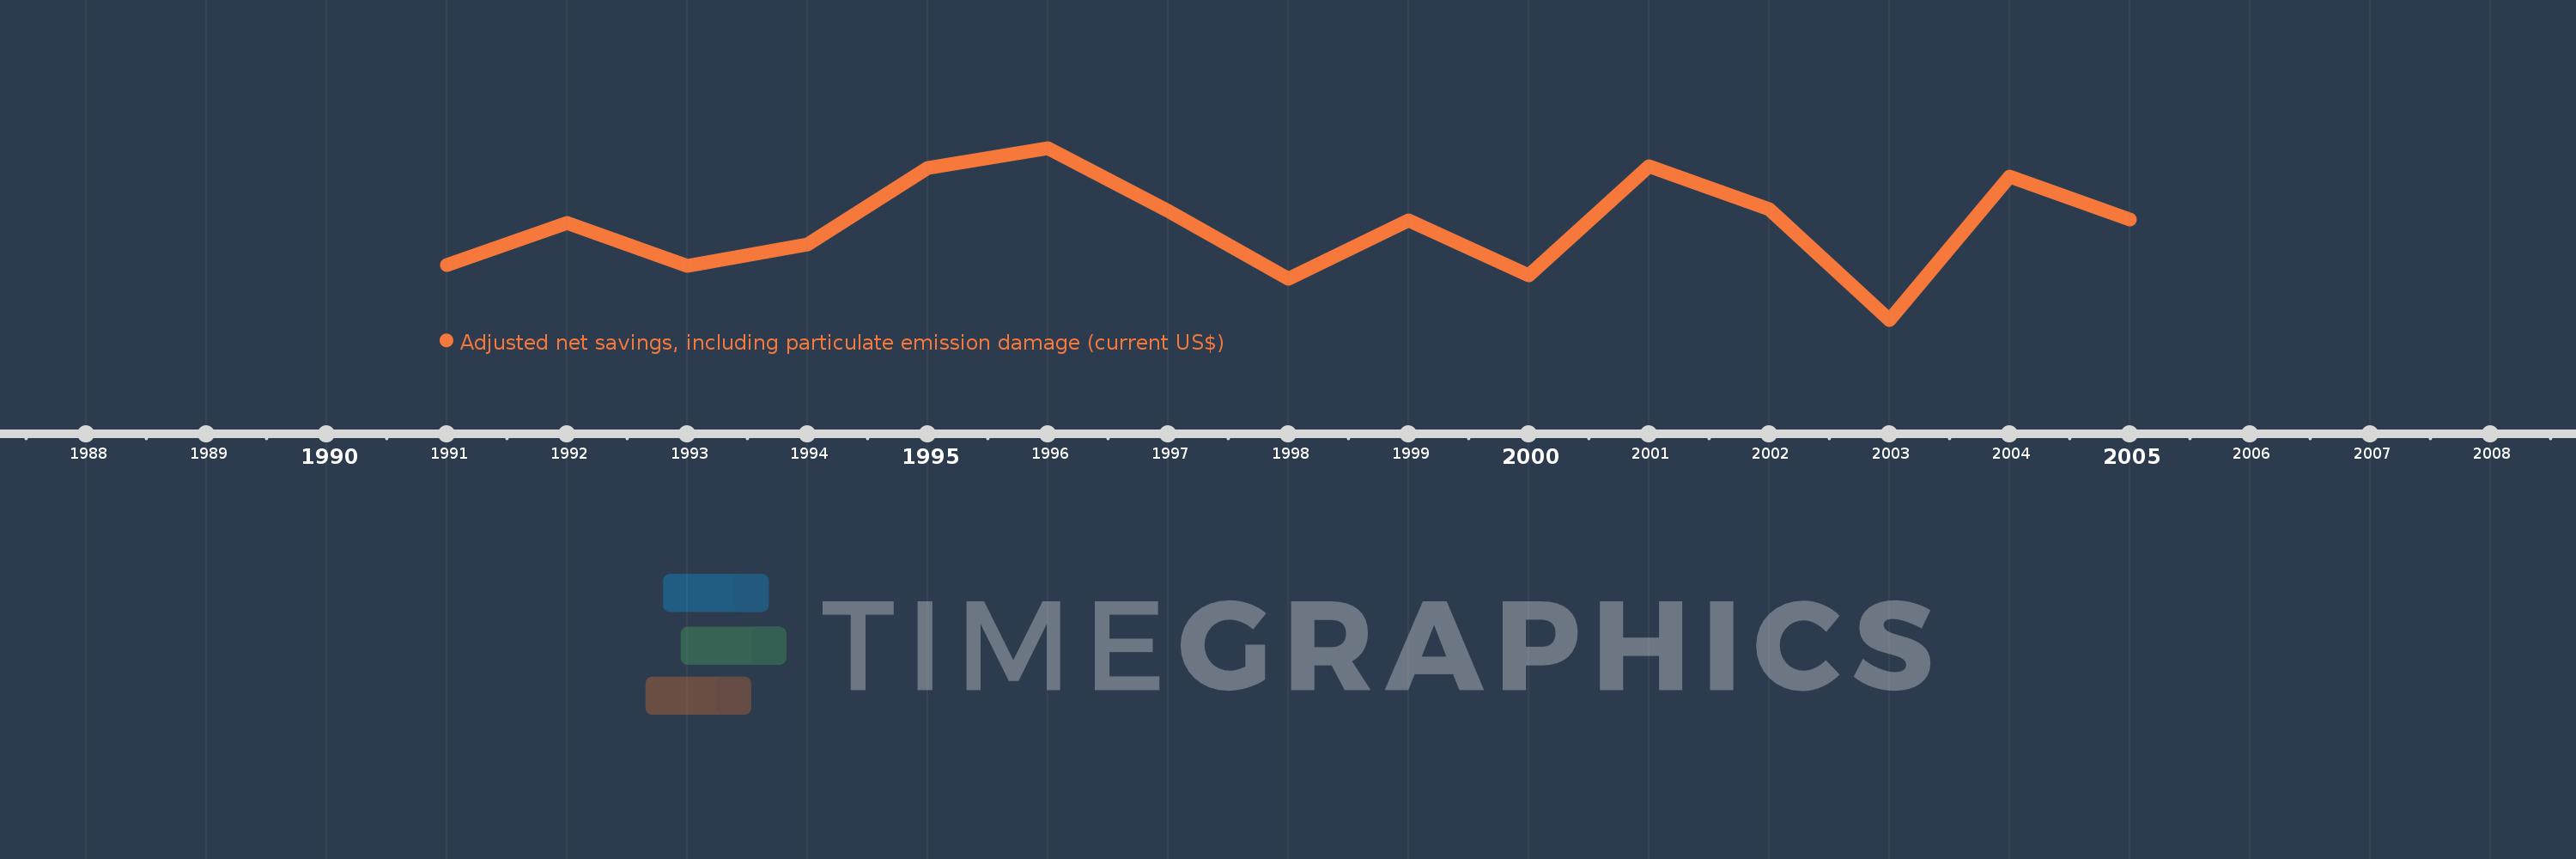
This timeline shows a graph from 1991 to 2005 of Papua New Guinea. No data until 1990. Number of actual observations by date: 15.
Source name:
World Development Indicators
Source organization:
World Bank staff estimates based on sources and methods in World Bank's "The Changing Wealth of Nations: Measuring Sustainable Development in the New Millennium" (2011).
Categories, topics:
Economy & Growth, Environment
Last updated:
apr 23, 2017
Indicators value changes by year
Meaning:
130.386 mln
Minimum:
-173.248 mln
jan 1, 2003
Maximum:
383.854 mln
jan 1, 1996
At the date of observation
Value
Absolute change
Change from the previous value
jan 1, 1991
4.103 mln
+4.103 mln
0.0%
jan 1, 1992
140.401 mln
+136.297 mln
3.32K%
jan 1, 1993
1.634 mln
-138.767 mln
-98.84%
jan 1, 1994
70.244 mln
+68.61 mln
4.2K%
jan 1, 1995
318.272 mln
+248.028 mln
353.1%
jan 1, 1996
383.854 mln
+65.583 mln
20.61%
jan 1, 1997
178.969 mln
-204.886 mln
-53.38%
jan 1, 1998
-41.466 mln
-220.435 mln
-123.17%
jan 1, 1999
149.872 mln
+191.339 mln
-461.43%
jan 1, 2000
-28.759 mln
-178.631 mln
-119.19%
jan 1, 2001
323.739 mln
+352.498 mln
-1.23K%
jan 1, 2002
184.532 mln
-139.208 mln
-43.0%
jan 1, 2003
-173.248 mln
-357.78 mln
-193.89%
jan 1, 2004
291.159 mln
+464.407 mln
-268.06%
jan 1, 2005
152.484 mln
-138.675 mln
-47.63%
Ranking of countries by current statistics by years