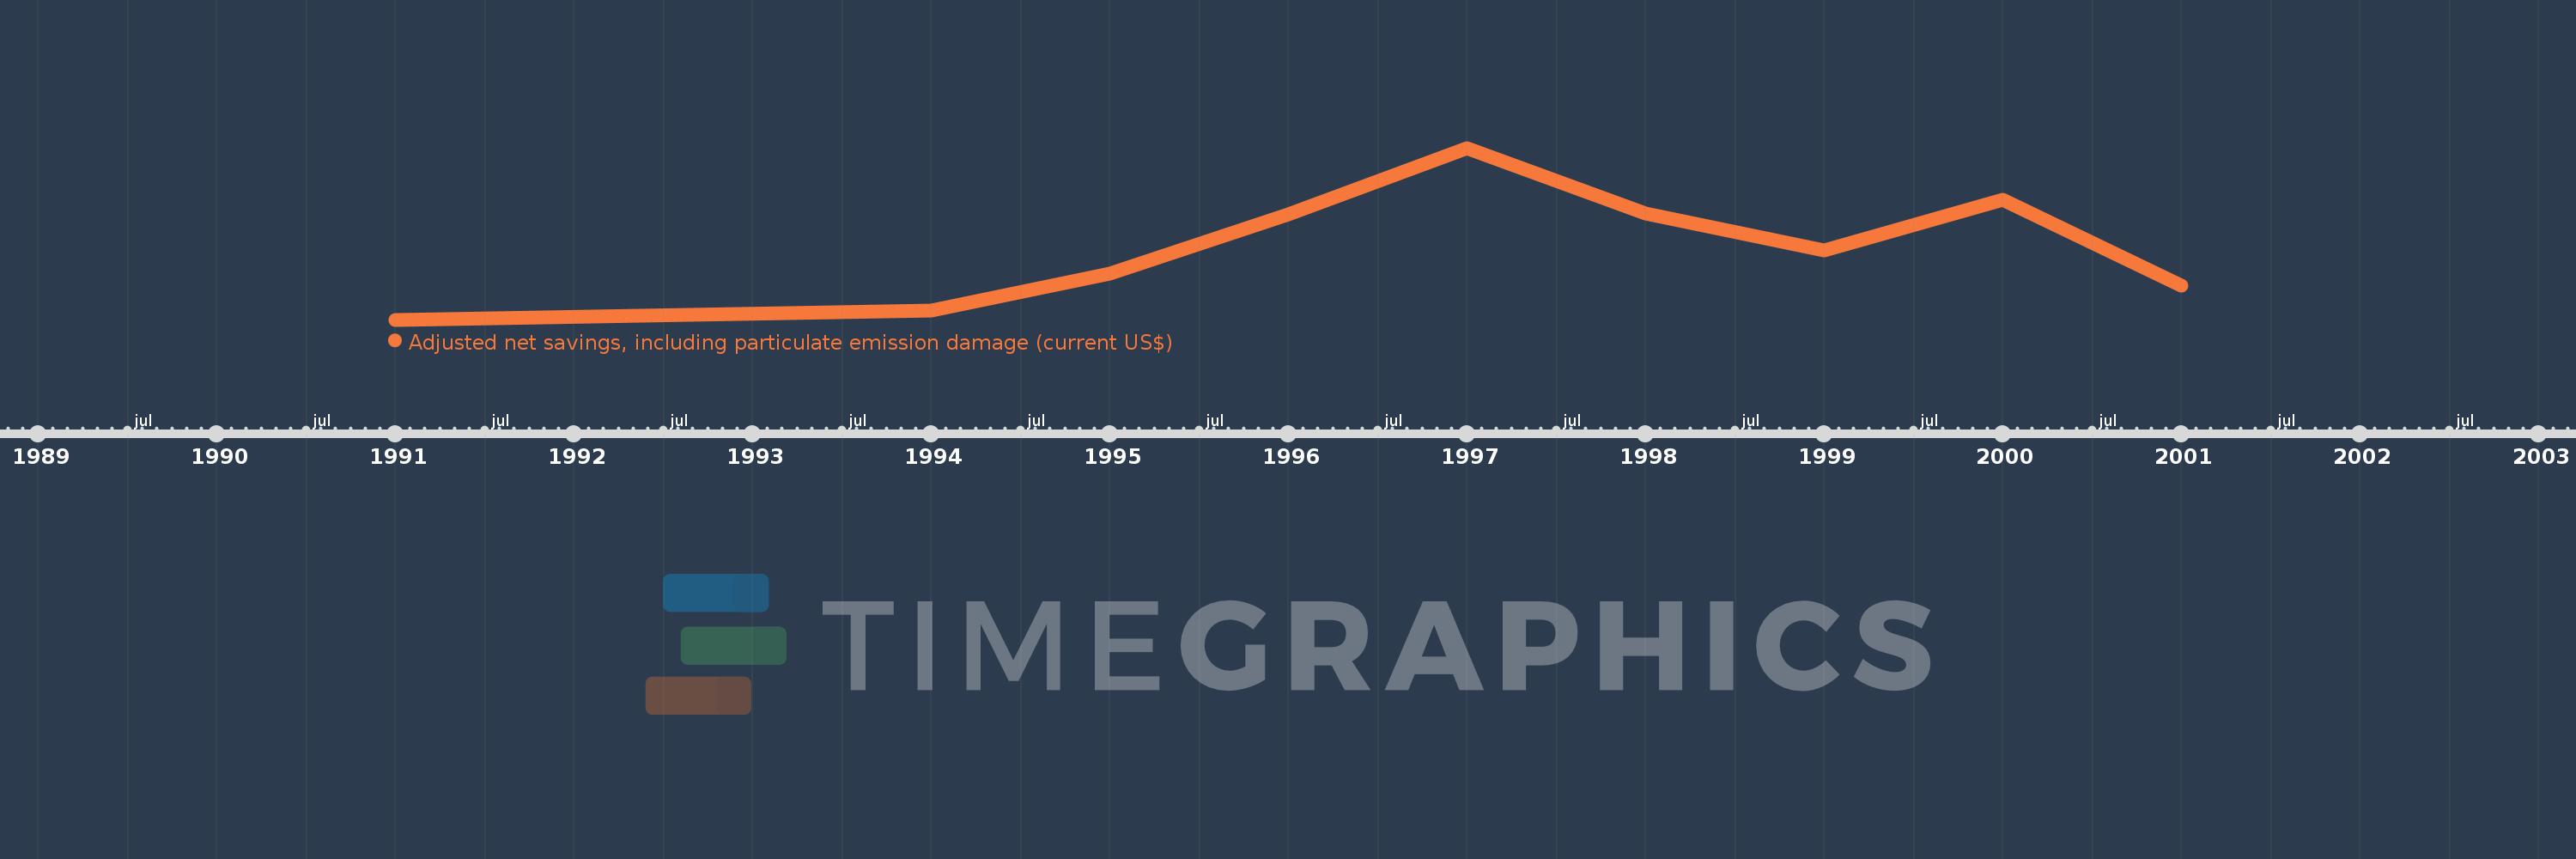
This timeline shows a graph from 1991 to 2001 of Iran, Islamic Rep.. No data until 1990. Number of actual observations by date: 9.
Source name:
World Development Indicators
Source organization:
World Bank staff estimates based on sources and methods in World Bank's "The Changing Wealth of Nations: Measuring Sustainable Development in the New Millennium" (2011).
Categories, topics:
Economy & Growth, Environment
Last updated:
apr 23, 2017
Indicators value changes by year
Meaning:
12.199 bln
Minimum:
5.463 bln
jan 1, 1991
Maximum:
21.208 bln
jan 1, 1997
At the date of observation
Value
Absolute change
Change from the previous value
jan 1, 1991
5.463 bln
+5.463 bln
0.0%
jan 1, 1994
6.28 bln
+817.546 mln
14.97%
jan 1, 1995
9.683 bln
+3.402 bln
54.17%
jan 1, 1996
15.12 bln
+5.437 bln
56.15%
jan 1, 1997
21.208 bln
+6.088 bln
40.26%
jan 1, 1998
15.196 bln
-6.012 bln
-28.35%
jan 1, 1999
11.831 bln
-3.364 bln
-22.14%
jan 1, 2000
16.45 bln
+4.619 bln
39.04%
jan 1, 2001
8.556 bln
-7.894 bln
-47.99%
Ranking of countries by current statistics by years