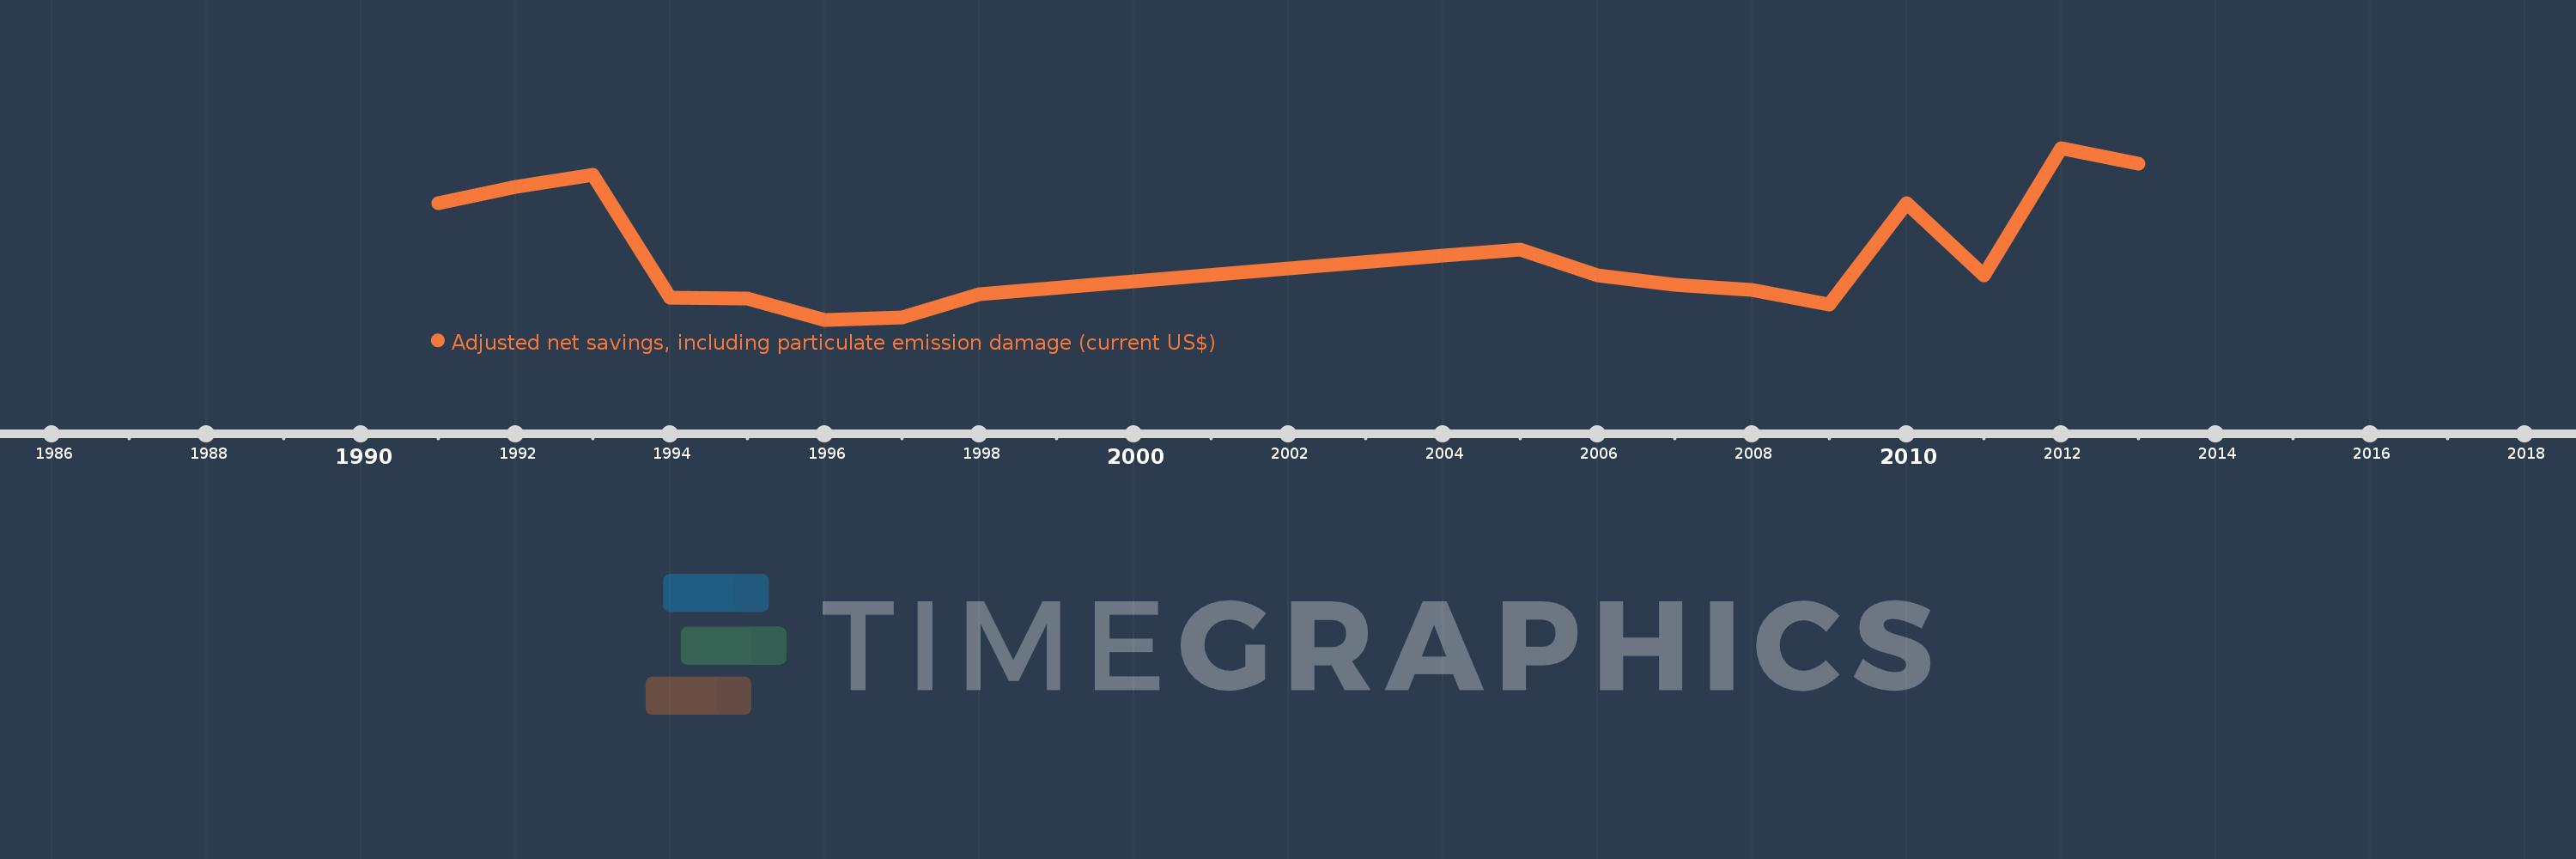
This timeline shows a graph from 1991 to 2013 of Gambia, The. No data until 1990. Number of actual observations by date: 18.
Source name:
World Development Indicators
Source organization:
World Bank staff estimates based on sources and methods in World Bank's "The Changing Wealth of Nations: Measuring Sustainable Development in the New Millennium" (2011).
Categories, topics:
Economy & Growth, Environment
Last updated:
apr 23, 2017
Indicators value changes by year
Meaning:
-44.798 mln
Minimum:
-134.946 mln
jan 1, 1996
Maximum:
94.688 mln
jan 1, 2012
At the date of observation
Value
Absolute change
Change from the previous value
jan 1, 1991
20.5 mln
+20.5 mln
0.0%
jan 1, 1992
43.002 mln
+22.502 mln
109.76%
jan 1, 1993
59.006 mln
+16.004 mln
37.22%
jan 1, 1994
-104.954 mln
-163.96 mln
-277.87%
jan 1, 1995
-106.595 mln
-1.641 mln
1.56%
jan 1, 1996
-134.946 mln
-28.351 mln
26.6%
jan 1, 1997
-132.128 mln
+2.818 mln
-2.09%
jan 1, 1998
-100.997 mln
+31.131 mln
-23.56%
jan 1, 2004
-49.034 mln
+51.963 mln
-51.45%
jan 1, 2005
-41.047 mln
+7.987 mln
-16.29%
jan 1, 2006
-75.14 mln
-34.093 mln
83.06%
jan 1, 2007
-88.504 mln
-13.364 mln
17.79%
jan 1, 2008
-95.543 mln
-7.039 mln
7.95%
jan 1, 2009
-114.431 mln
-18.888 mln
19.77%
jan 1, 2010
21.106 mln
+135.537 mln
-118.44%
jan 1, 2011
-75.299 mln
-96.405 mln
-456.76%
jan 1, 2012
94.688 mln
+169.987 mln
-225.75%
jan 1, 2013
73.958 mln
-20.73 mln
-21.89%
Ranking of countries by current statistics by years