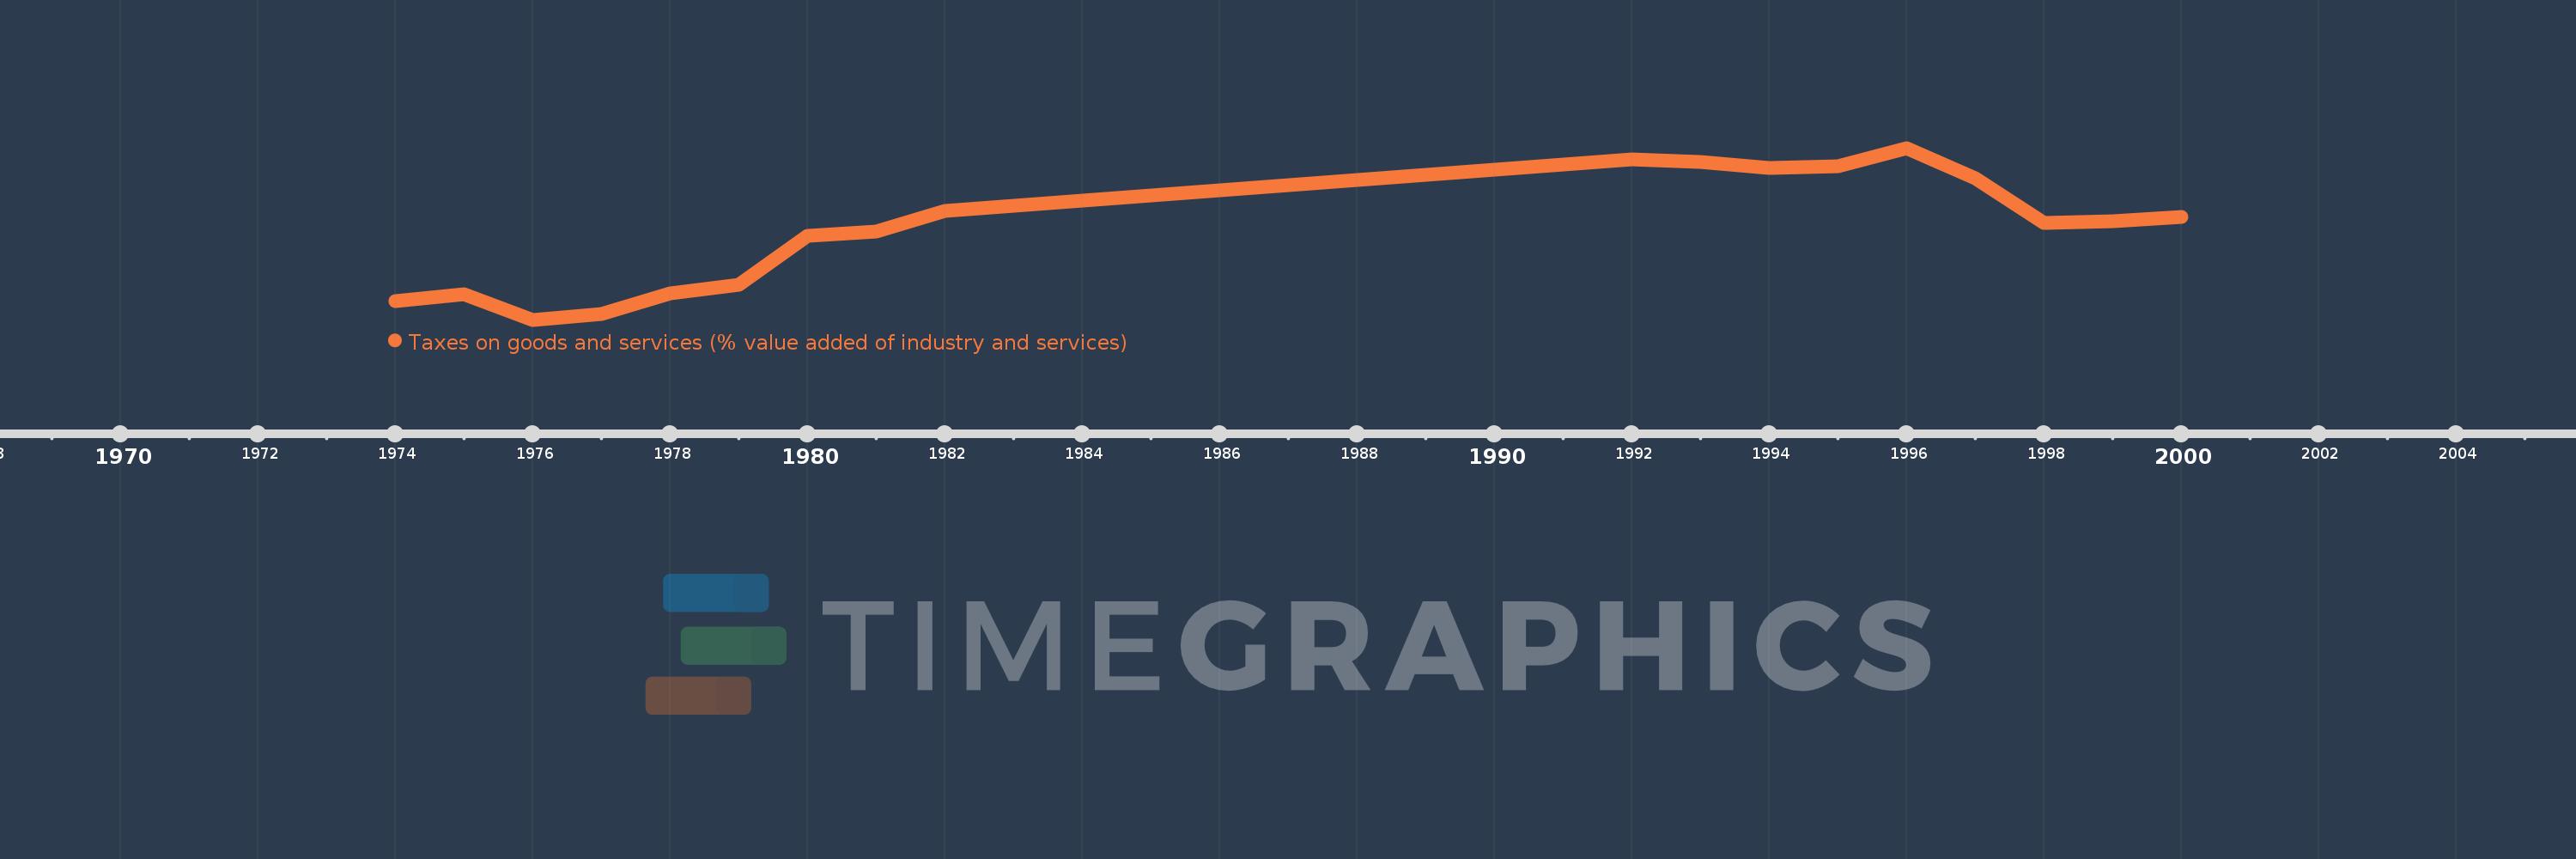
Questa scala temporale mostra un grafico dal 1974 anno al 2000 anno. Burundi. I dati fino ad 1973 anno non disponibili. Il numero di osservazioni attuali secondo i date: 18.
La fonte (nome):
Indicatori dello sviluppo mondiale
La fonte (organizzazione):
International Monetary Fund, Government Finance Statistics Yearbook and data files, and World Bank and OECD value added estimates.
Categorie:
Public Sector
sono stati aggiornati
23 apr 2017 anni
Indicatori delle variazioni dei valori per anni
In media:
12.686
Minima:
7.615
1 gen 1976 anni
Massimo:
17.253
1 gen 1996 anni
Alla data di osservazione
Valore
Variazione assoluta
La variazione rispetto al valore precedente
1 gen 1974 anni
8.679
+8.679
0.0%
1 gen 1975 anni
9.036
+0.357
4.11%
1 gen 1976 anni
7.615
-1.421
-15.73%
1 gen 1977 anni
7.944
+0.329
4.32%
1 gen 1978 anni
9.103
+1.16
14.6%
1 gen 1979 anni
9.569
+0.465
5.11%
1 gen 1980 anni
12.333
+2.764
28.88%
1 gen 1981 anni
12.554
+0.221
1.79%
1 gen 1982 anni
13.73
+1.177
9.37%
1 gen 1992 anni
16.63
+2.9
21.12%
1 gen 1993 anni
16.454
-0.176
-1.06%
1 gen 1994 anni
16.149
-0.305
-1.85%
1 gen 1995 anni
16.203
+0.054
0.34%
1 gen 1996 anni
17.253
+1.05
6.48%
1 gen 1997 anni
15.54
-1.713
-9.93%
1 gen 1998 anni
13.024
-2.516
-16.19%
1 gen 1999 anni
13.121
+0.097
0.74%
1 gen 2000 anni
13.404
+0.283
2.16%
Classificazione dei paesi secondo i statistiche attuali per anni