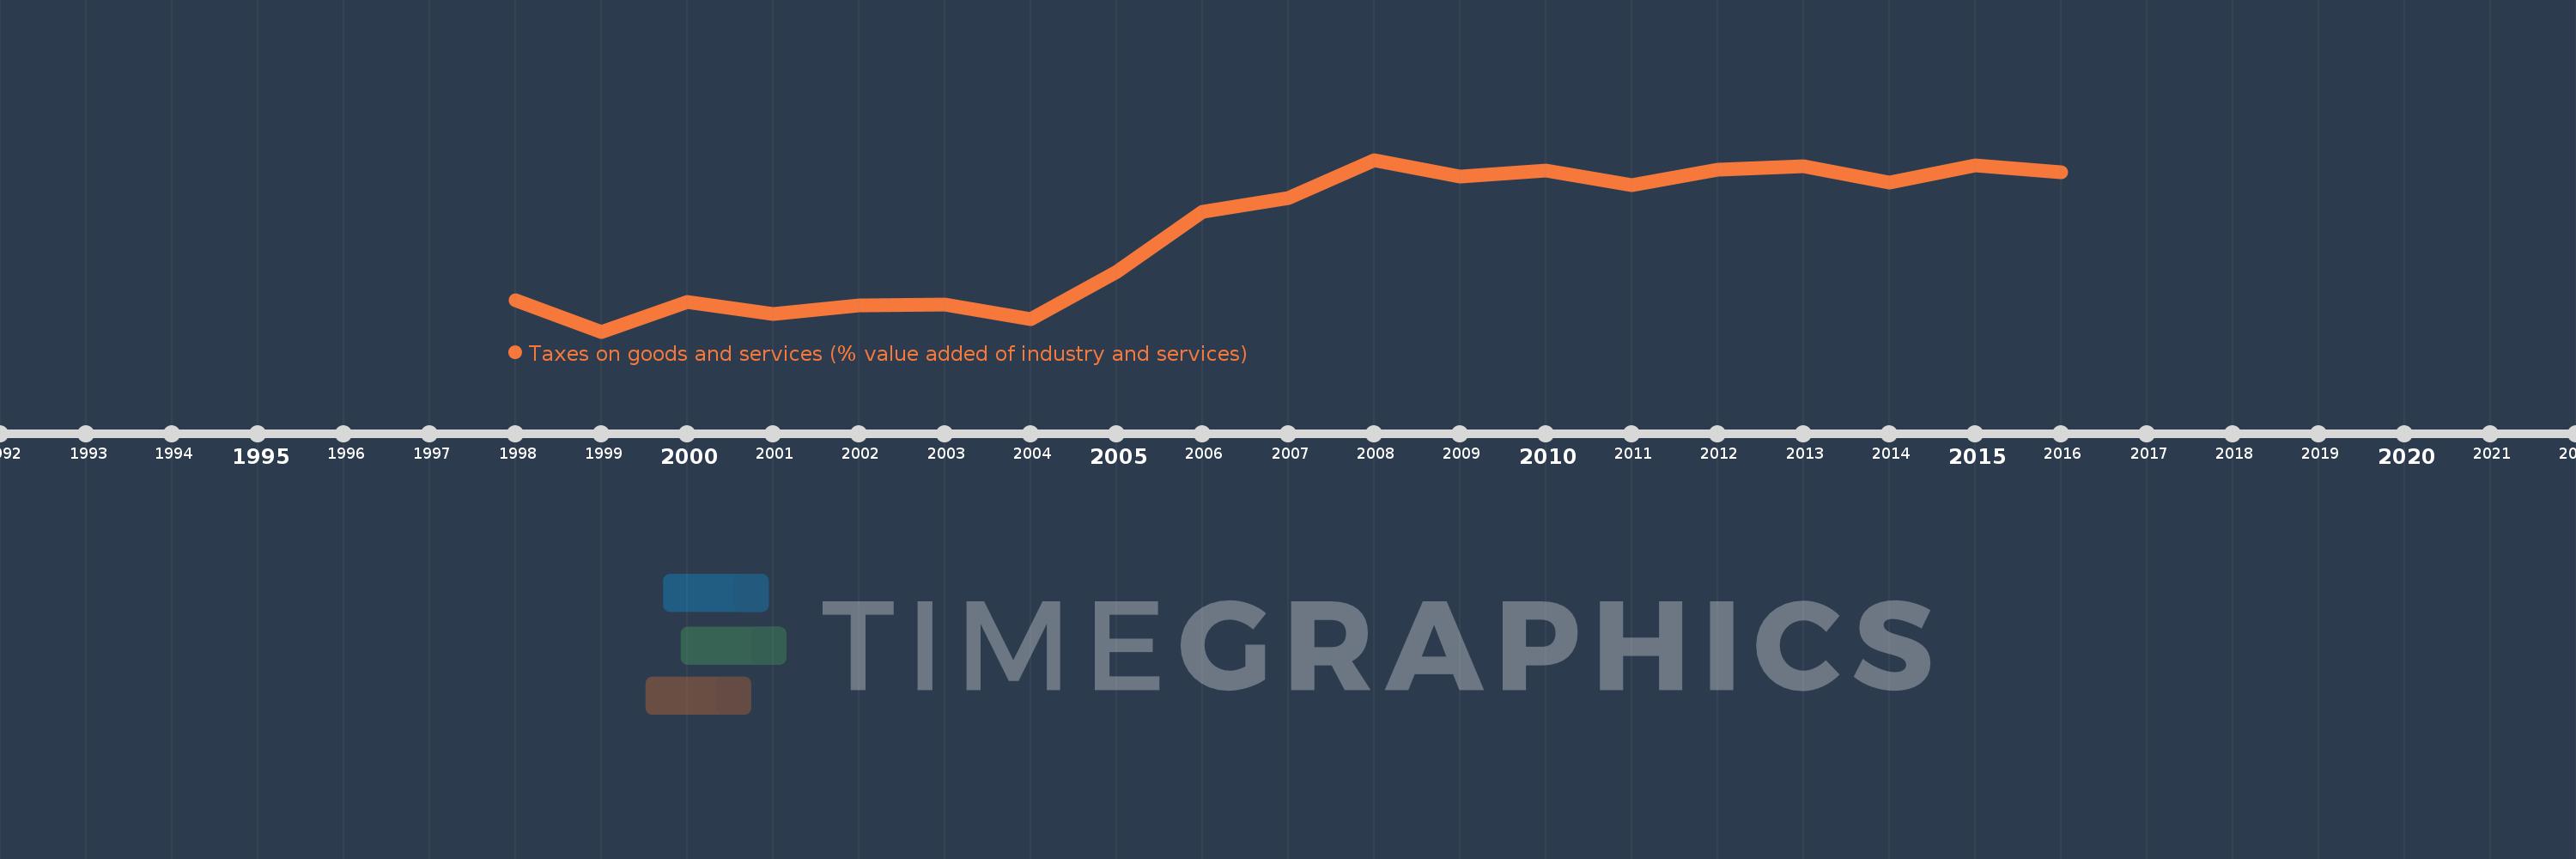
Questa scala temporale mostra un grafico dal 1998 anno al 2016 anno. Georgia. I dati fino ad 1997 anno non disponibili. Il numero di osservazioni attuali secondo i date: 19.
La fonte (nome):
Indicatori dello sviluppo mondiale
La fonte (organizzazione):
International Monetary Fund, Government Finance Statistics Yearbook and data files, and World Bank and OECD value added estimates.
Categorie:
Public Sector
sono stati aggiornati
23 apr 2017 anni
Indicatori delle variazioni dei valori per anni
In media:
13.656
Minima:
7.099
1 gen 1999 anni
Massimo:
18.411
1 gen 2008 anni
Alla data di osservazione
Valore
Variazione assoluta
La variazione rispetto al valore precedente
1 gen 1998 anni
9.187
+9.187
0.0%
1 gen 1999 anni
7.099
-2.088
-22.73%
1 gen 2000 anni
9.058
+1.958
27.59%
1 gen 2001 anni
8.262
-0.796
-8.79%
1 gen 2002 anni
8.818
+0.556
6.73%
1 gen 2003 anni
8.853
+0.035
0.39%
1 gen 2004 anni
7.892
-0.961
-10.85%
1 gen 2005 anni
11.002
+3.11
39.41%
1 gen 2006 anni
14.968
+3.967
36.05%
1 gen 2007 anni
15.885
+0.916
6.12%
1 gen 2008 anni
18.411
+2.526
15.9%
1 gen 2009 anni
17.284
-1.127
-6.12%
1 gen 2010 anni
17.708
+0.424
2.45%
1 gen 2011 anni
16.746
-0.962
-5.43%
1 gen 2012 anni
17.779
+1.033
6.17%
1 gen 2013 anni
17.985
+0.206
1.16%
1 gen 2014 anni
16.888
-1.097
-6.1%
1 gen 2015 anni
18.046
+1.158
6.86%
1 gen 2016 anni
17.585
-0.461
-2.56%
Classificazione dei paesi secondo i statistiche attuali per anni