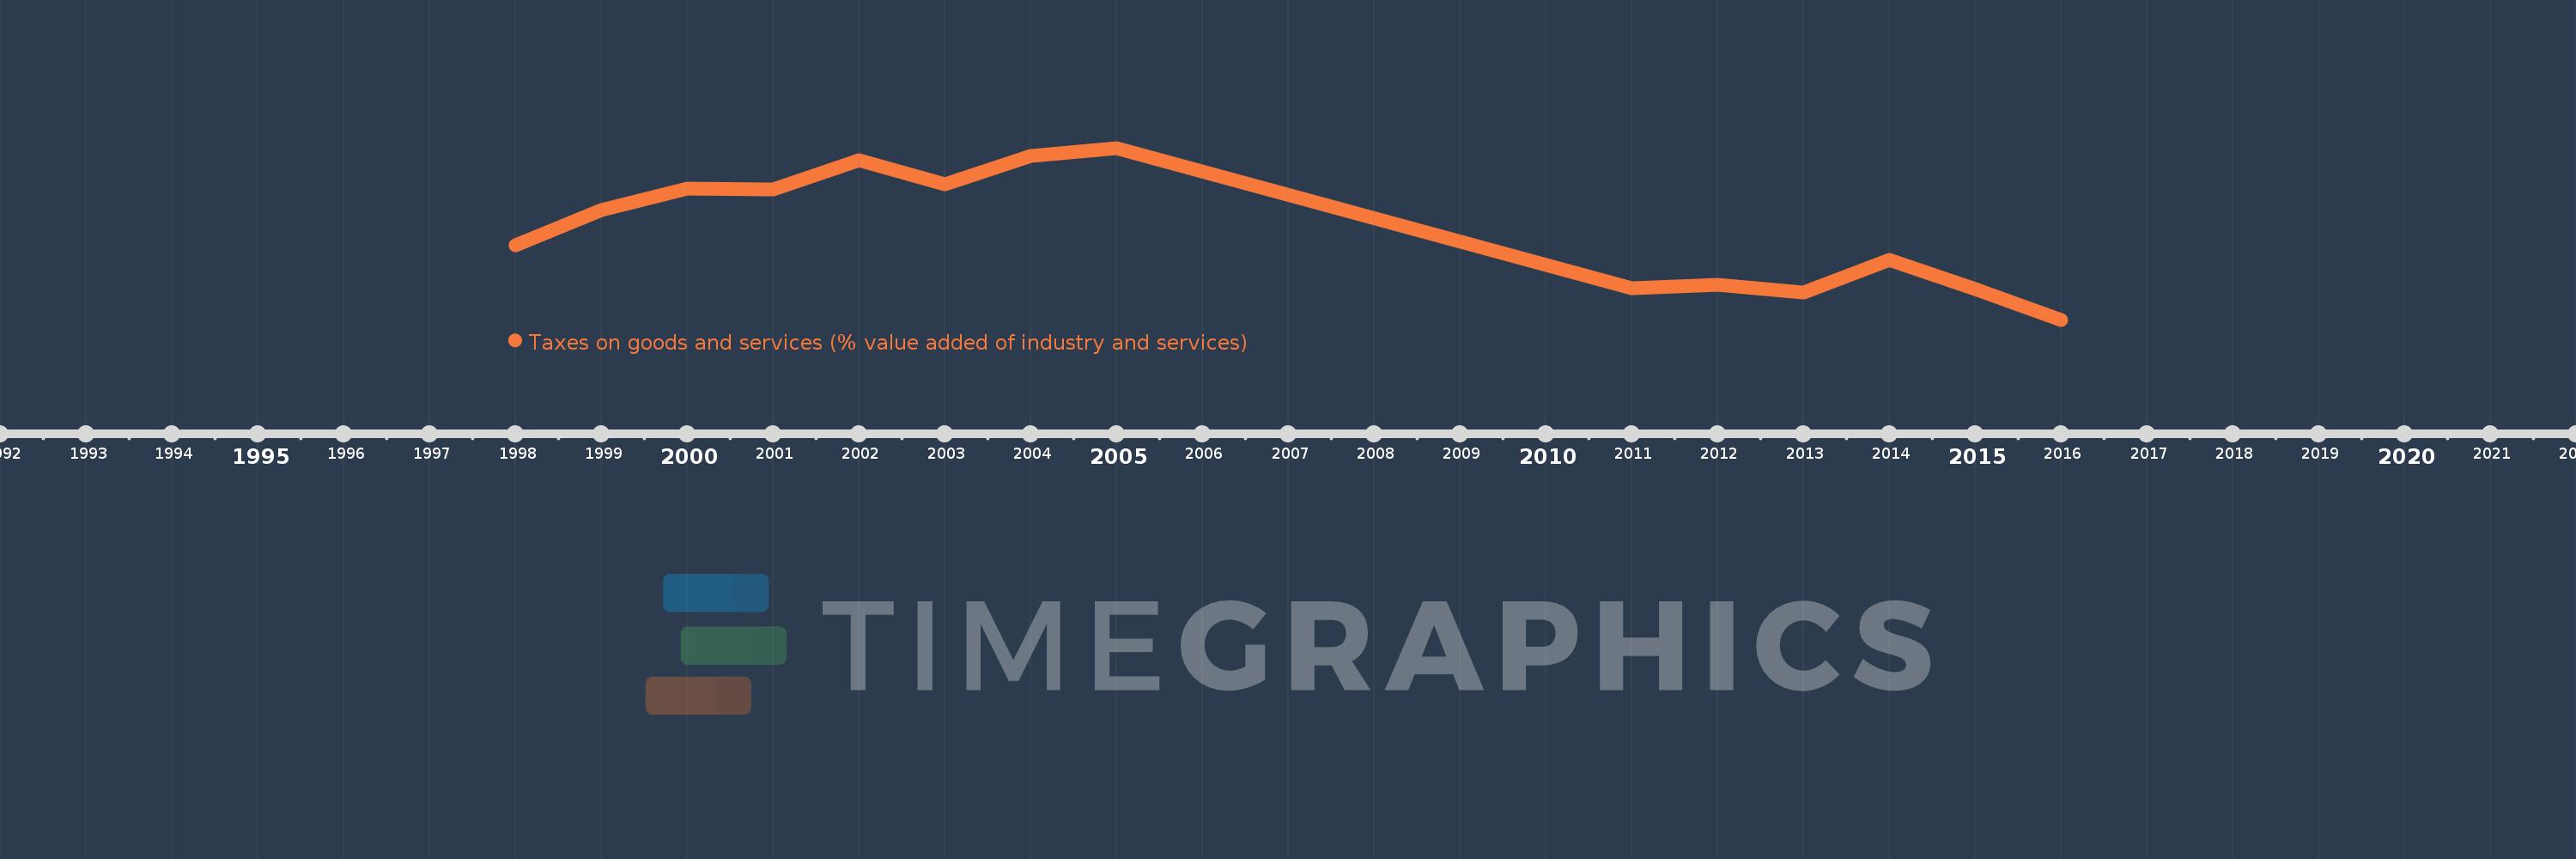
Questa scala temporale mostra un grafico dal 1998 anno al 2016 anno. Kazakhstan. I dati fino ad 1997 anno non disponibili. Il numero di osservazioni attuali secondo i date: 14.
La fonte (nome):
Indicatori dello sviluppo mondiale
La fonte (organizzazione):
International Monetary Fund, Government Finance Statistics Yearbook and data files, and World Bank and OECD value added estimates.
Categorie:
Public Sector
sono stati aggiornati
23 apr 2017 anni
Indicatori delle variazioni dei valori per anni
In media:
5.267
Minima:
2.828
1 gen 2016 anni
Massimo:
7.487
1 gen 2005 anni
Alla data di osservazione
Valore
Variazione assoluta
La variazione rispetto al valore precedente
1 gen 1998 anni
4.839
+4.839
0.0%
1 gen 1999 anni
5.8
+0.961
19.85%
1 gen 2000 anni
6.379
+0.579
9.99%
1 gen 2001 anni
6.363
-0.016
-0.26%
1 gen 2002 anni
7.148
+0.785
12.33%
1 gen 2003 anni
6.509
-0.639
-8.94%
1 gen 2004 anni
7.267
+0.758
11.64%
1 gen 2005 anni
7.487
+0.221
3.03%
1 gen 2011 anni
3.683
-3.805
-50.81%
1 gen 2012 anni
3.768
+0.086
2.33%
1 gen 2013 anni
3.561
-0.207
-5.49%
1 gen 2014 anni
4.449
+0.887
24.91%
1 gen 2015 anni
3.655
-0.794
-17.84%
1 gen 2016 anni
2.828
-0.827
-22.63%
Classificazione dei paesi secondo i statistiche attuali per anni