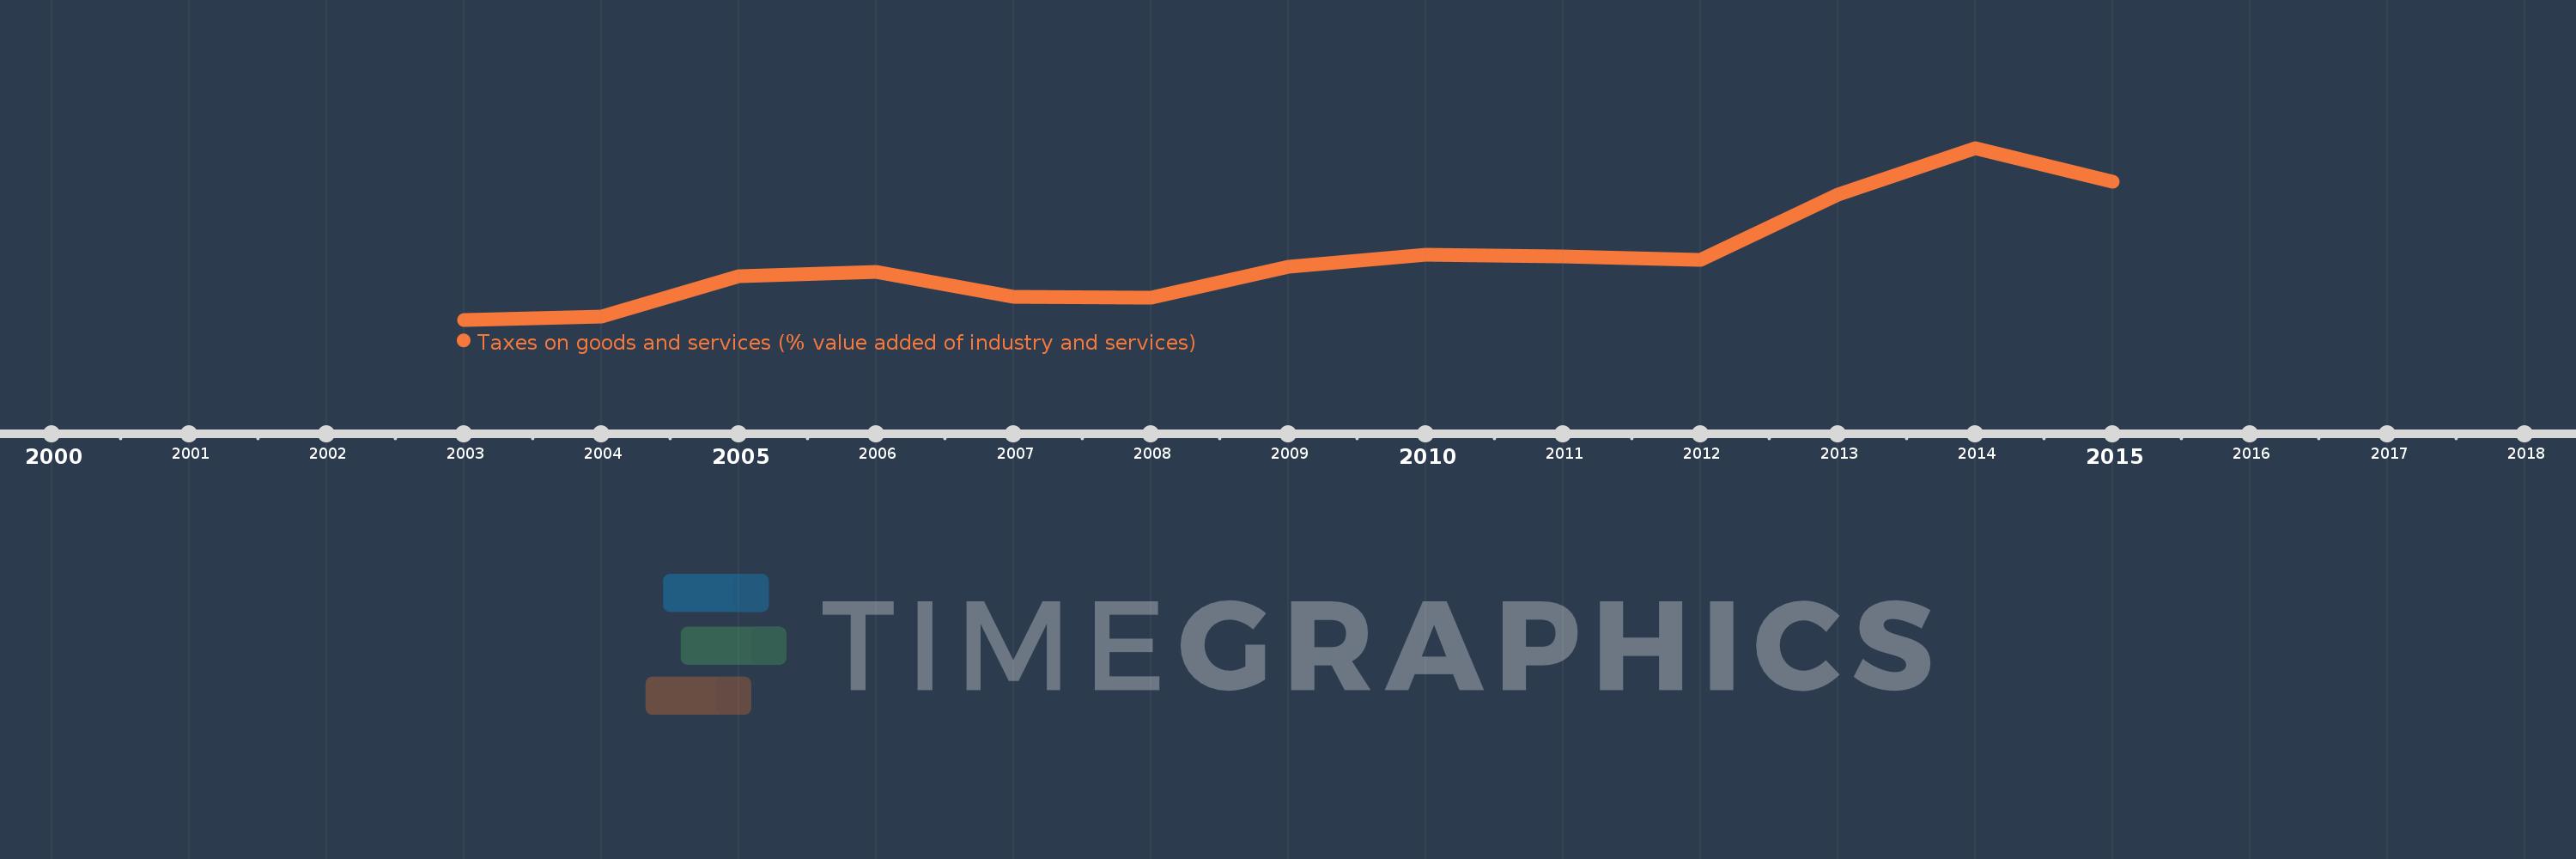
Questa scala temporale mostra un grafico dal 2003 anno al 2015 anno. Burkina Faso. I dati fino ad 2002 anno non disponibili. Il numero di osservazioni attuali secondo i date: 13.
La fonte (nome):
Indicatori dello sviluppo mondiale
La fonte (organizzazione):
International Monetary Fund, Government Finance Statistics Yearbook and data files, and World Bank and OECD value added estimates.
Categorie:
Public Sector
sono stati aggiornati
23 apr 2017 anni
Indicatori delle variazioni dei valori per anni
In media:
12.146
Minima:
10.217
1 gen 2003 anni
Massimo:
15.491
1 gen 2014 anni
Alla data di osservazione
Valore
Variazione assoluta
La variazione rispetto al valore precedente
1 gen 2003 anni
10.217
+10.217
0.0%
1 gen 2004 anni
10.326
+0.109
1.07%
1 gen 2005 anni
11.564
+1.238
11.99%
1 gen 2006 anni
11.697
+0.133
1.15%
1 gen 2007 anni
10.921
-0.775
-6.63%
1 gen 2008 anni
10.893
-0.029
-0.26%
1 gen 2009 anni
11.856
+0.963
8.85%
1 gen 2010 anni
12.204
+0.348
2.94%
1 gen 2011 anni
12.172
-0.032
-0.27%
1 gen 2012 anni
12.043
-0.129
-1.06%
1 gen 2013 anni
14.059
+2.017
16.75%
1 gen 2014 anni
15.491
+1.431
10.18%
1 gen 2015 anni
14.462
-1.029
-6.64%
Classificazione dei paesi secondo i statistiche attuali per anni