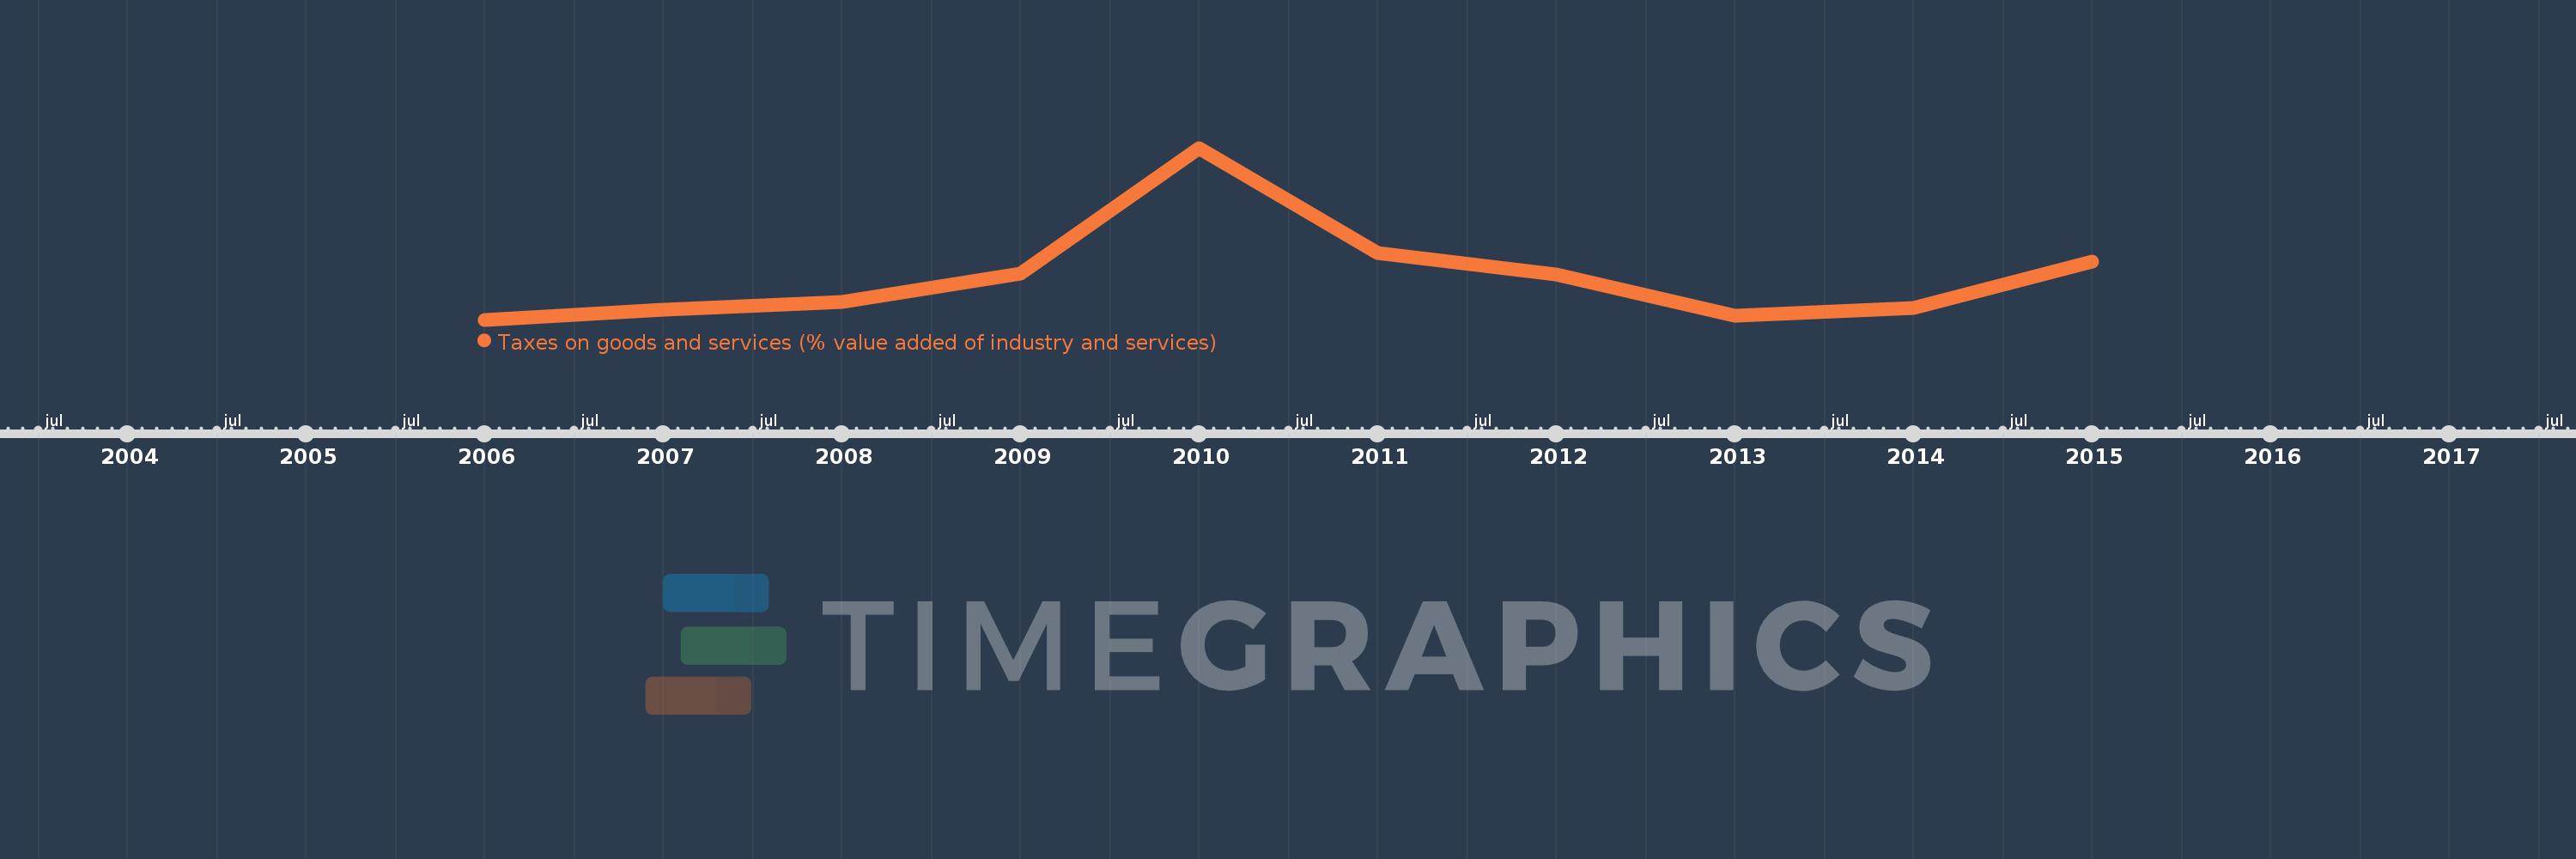
Questa scala temporale mostra un grafico dal 2006 anno al 2015 anno. West Bank and Gaza. I dati fino ad 2005 anno non disponibili. Il numero di osservazioni attuali secondo i date: 10.
La fonte (nome):
Indicatori dello sviluppo mondiale
La fonte (organizzazione):
International Monetary Fund, Government Finance Statistics Yearbook and data files, and World Bank and OECD value added estimates.
Categorie:
Public Sector
sono stati aggiornati
23 apr 2017 anni
Indicatori delle variazioni dei valori per anni
In media:
4.091
Minima:
3.417
1 gen 2006 anni
Massimo:
6.094
1 gen 2010 anni
Alla data di osservazione
Valore
Variazione assoluta
La variazione rispetto al valore precedente
1 gen 2006 anni
3.417
+3.417
0.0%
1 gen 2007 anni
3.575
+0.158
4.62%
1 gen 2008 anni
3.698
+0.123
3.45%
1 gen 2009 anni
4.141
+0.443
11.98%
1 gen 2010 anni
6.094
+1.952
47.15%
1 gen 2011 anni
4.456
-1.638
-26.88%
1 gen 2012 anni
4.129
-0.327
-7.34%
1 gen 2013 anni
3.482
-0.647
-15.67%
1 gen 2014 anni
3.602
+0.121
3.46%
1 gen 2015 anni
4.32
+0.717
19.91%
Classificazione dei paesi secondo i statistiche attuali per anni