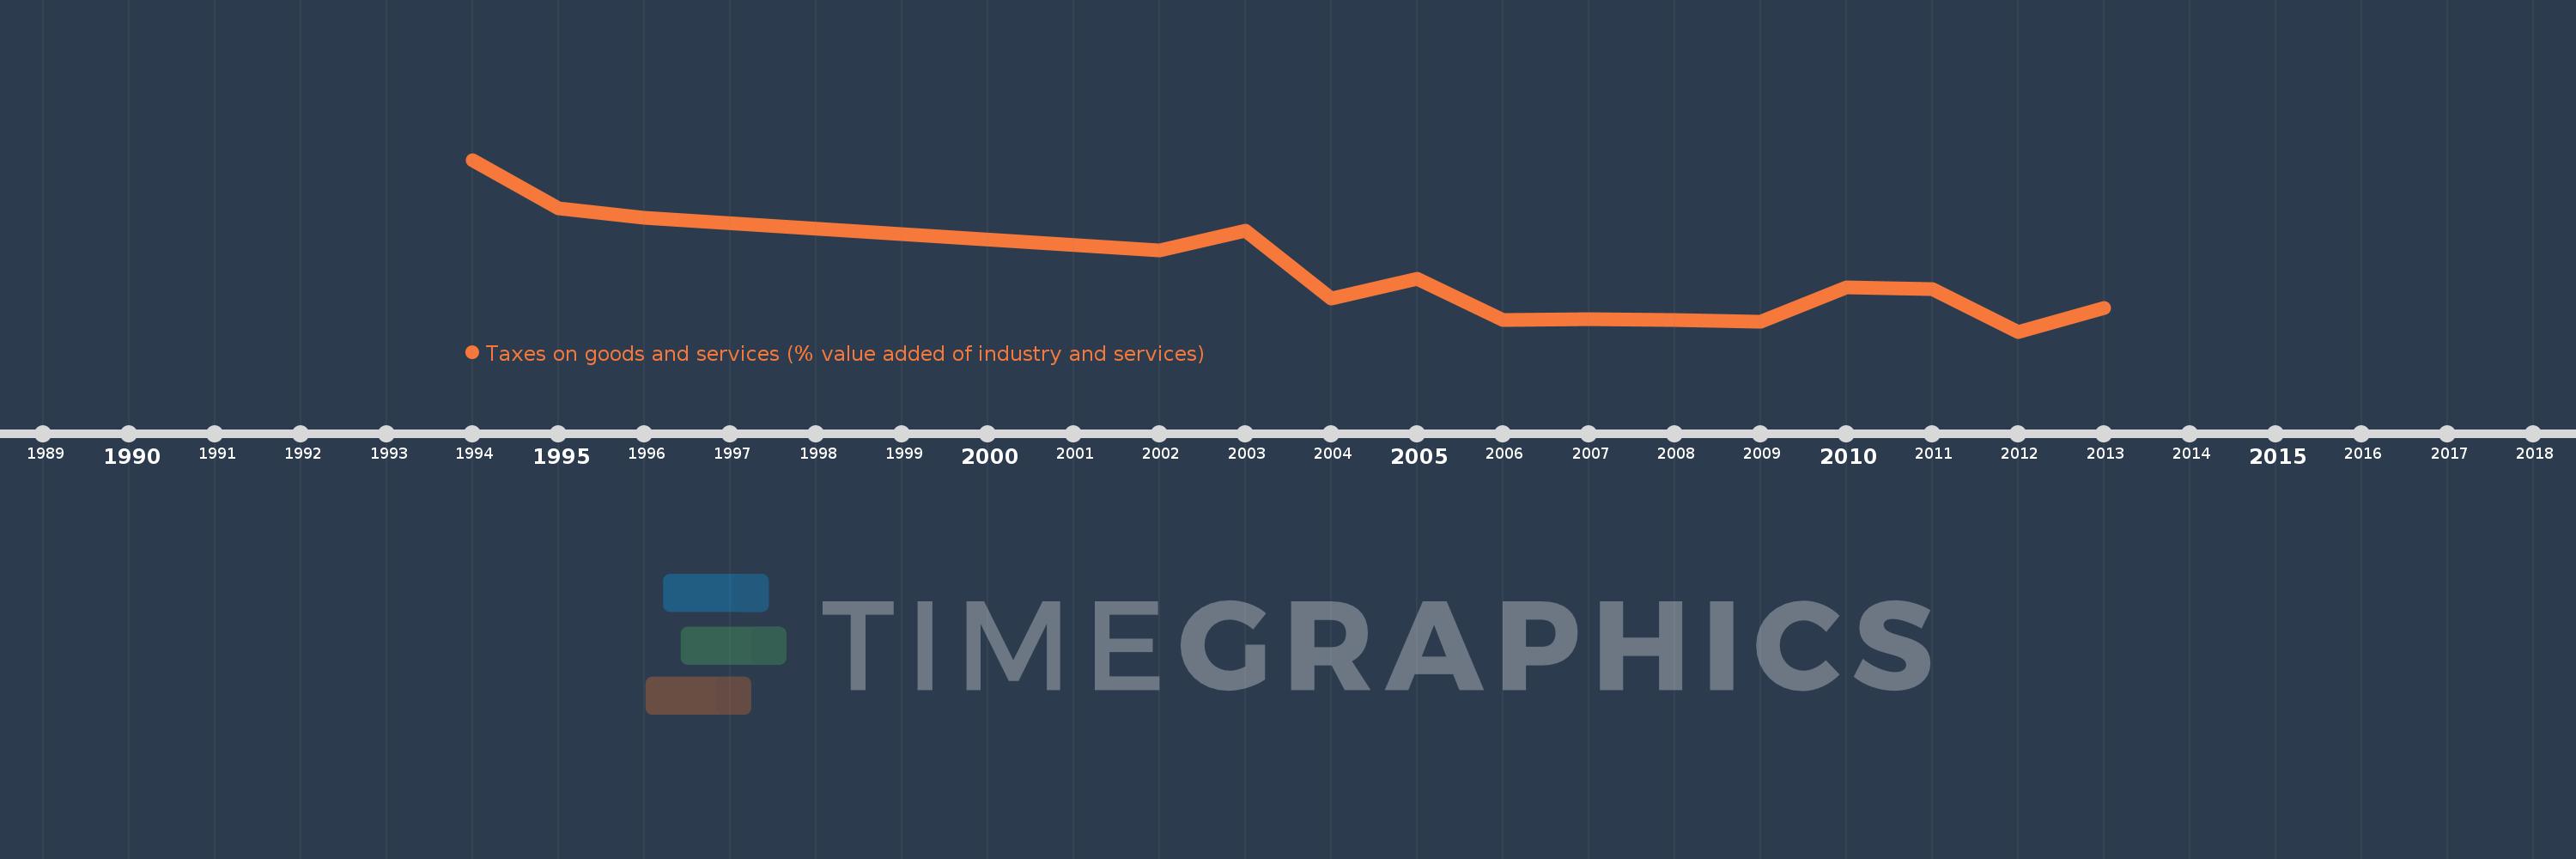
Questa scala temporale mostra un grafico dal 1994 anno al 2013 anno. Trinidad and Tobago. I dati fino ad 1993 anno non disponibili. Il numero di osservazioni attuali secondo i date: 15.
La fonte (nome):
Indicatori dello sviluppo mondiale
La fonte (organizzazione):
International Monetary Fund, Government Finance Statistics Yearbook and data files, and World Bank and OECD value added estimates.
Categorie:
Public Sector
sono stati aggiornati
23 apr 2017 anni
Indicatori delle variazioni dei valori per anni
In media:
5.911
Minima:
4.292
1 gen 2012 anni
Massimo:
9.298
1 gen 1994 anni
Alla data di osservazione
Valore
Variazione assoluta
La variazione rispetto al valore precedente
1 gen 1994 anni
9.298
+9.298
0.0%
1 gen 1995 anni
7.886
-1.412
-15.18%
1 gen 1996 anni
7.602
-0.284
-3.61%
1 gen 2002 anni
6.66
-0.942
-12.39%
1 gen 2003 anni
7.232
+0.572
8.58%
1 gen 2004 anni
5.268
-1.964
-27.16%
1 gen 2005 anni
5.839
+0.572
10.85%
1 gen 2006 anni
4.633
-1.207
-20.66%
1 gen 2007 anni
4.652
+0.02
0.42%
1 gen 2008 anni
4.638
-0.015
-0.32%
1 gen 2009 anni
4.574
-0.064
-1.37%
1 gen 2010 anni
5.57
+0.997
21.79%
1 gen 2011 anni
5.538
-0.032
-0.58%
1 gen 2012 anni
4.292
-1.246
-22.5%
1 gen 2013 anni
4.977
+0.685
15.96%
Classificazione dei paesi secondo i statistiche attuali per anni