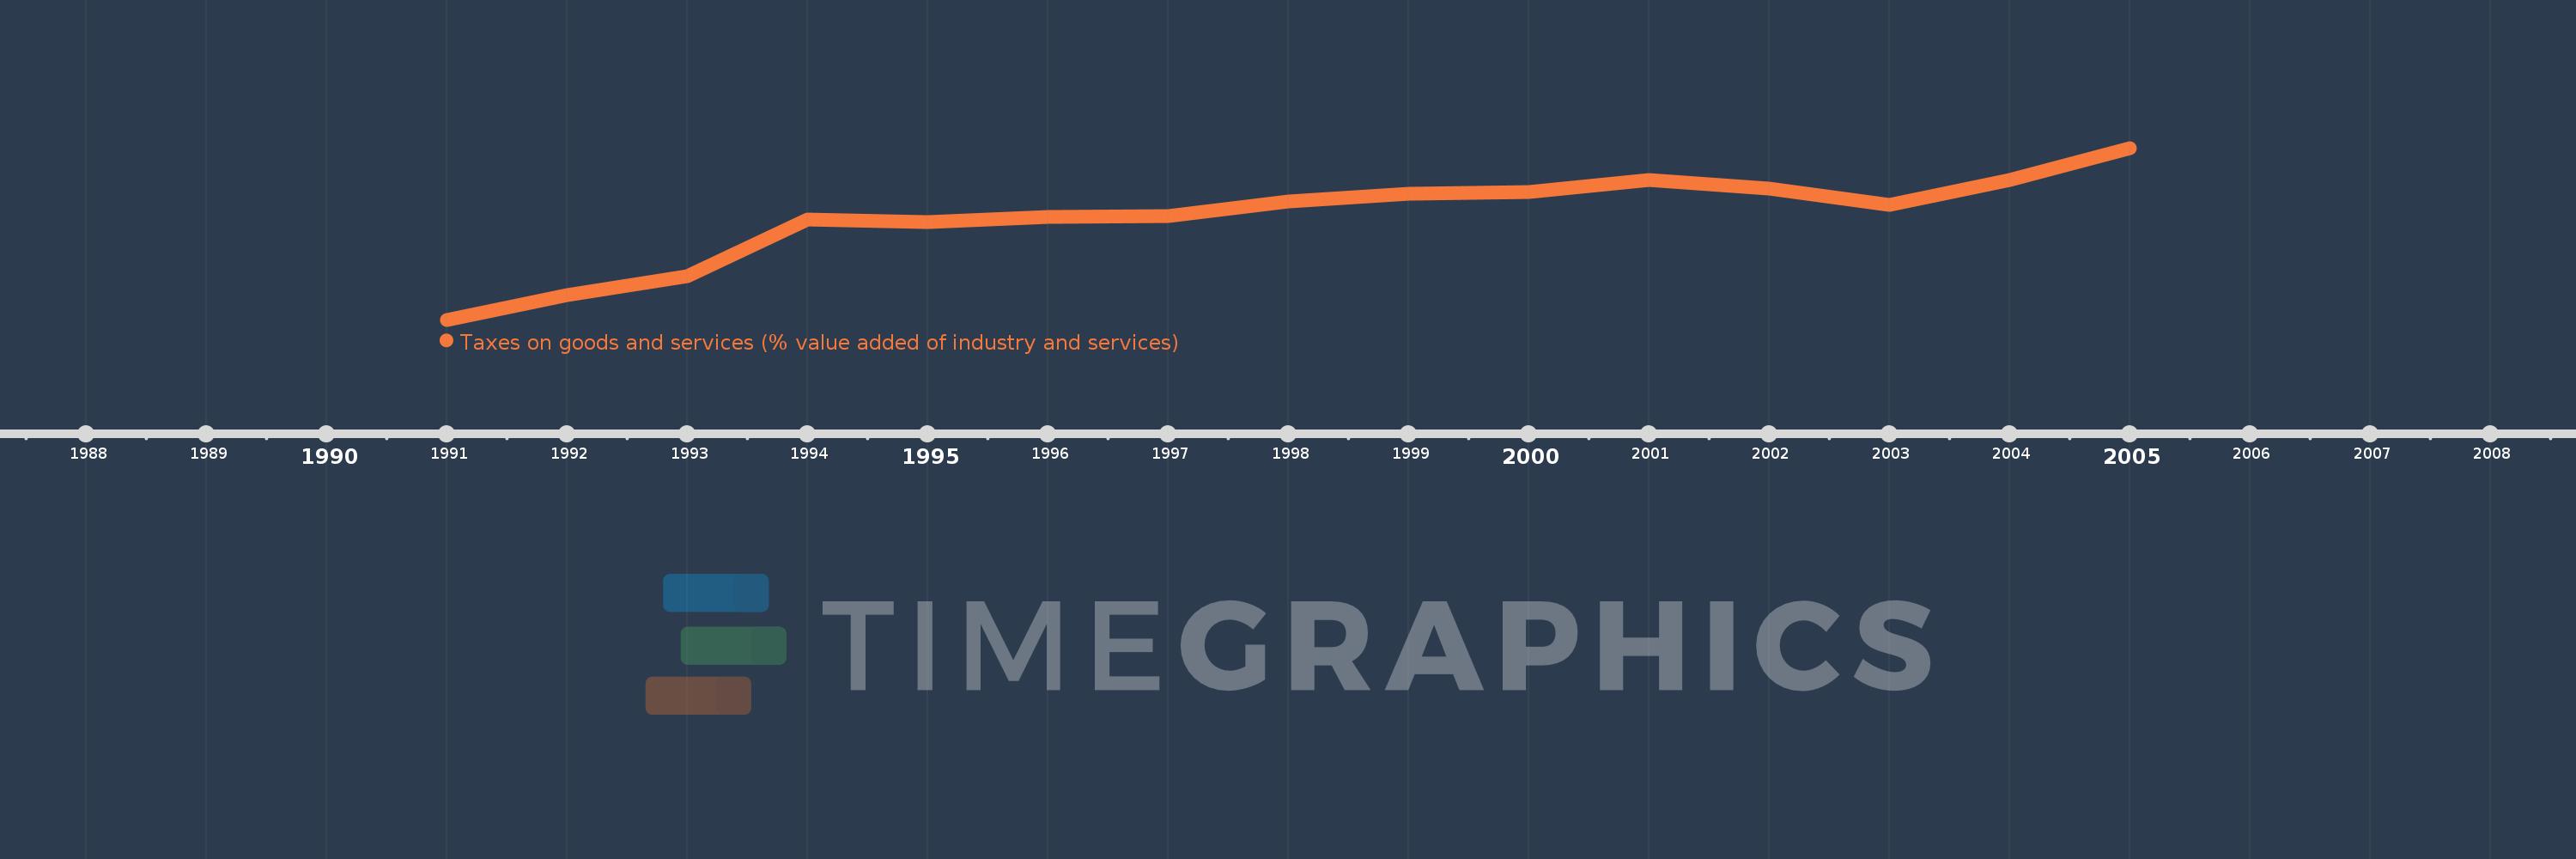
Questa scala temporale mostra un grafico dal 1991 anno al 2005 anno. Argentina. I dati fino ad 1990 anno non disponibili. Il numero di osservazioni attuali secondo i date: 15.
La fonte (nome):
Indicatori dello sviluppo mondiale
La fonte (organizzazione):
International Monetary Fund, Government Finance Statistics Yearbook and data files, and World Bank and OECD value added estimates.
Categorie:
Public Sector
sono stati aggiornati
23 apr 2017 anni
Indicatori delle variazioni dei valori per anni
In media:
5.868
Minima:
2.483
1 gen 1991 anni
Massimo:
8.138
1 gen 2005 anni
Alla data di osservazione
Valore
Variazione assoluta
La variazione rispetto al valore precedente
1 gen 1991 anni
2.483
+2.483
0.0%
1 gen 1992 anni
3.293
+0.811
32.65%
1 gen 1993 anni
3.917
+0.623
18.92%
1 gen 1994 anni
5.787
+1.871
47.76%
1 gen 1995 anni
5.699
-0.088
-1.52%
1 gen 1996 anni
5.873
+0.174
3.05%
1 gen 1997 anni
5.907
+0.034
0.58%
1 gen 1998 anni
6.382
+0.475
8.03%
1 gen 1999 anni
6.619
+0.237
3.71%
1 gen 2000 anni
6.696
+0.077
1.17%
1 gen 2001 anni
7.072
+0.376
5.62%
1 gen 2002 anni
6.799
-0.273
-3.86%
1 gen 2003 anni
6.269
-0.53
-7.8%
1 gen 2004 anni
7.086
+0.817
13.04%
1 gen 2005 anni
8.138
+1.052
14.84%
Classificazione dei paesi secondo i statistiche attuali per anni