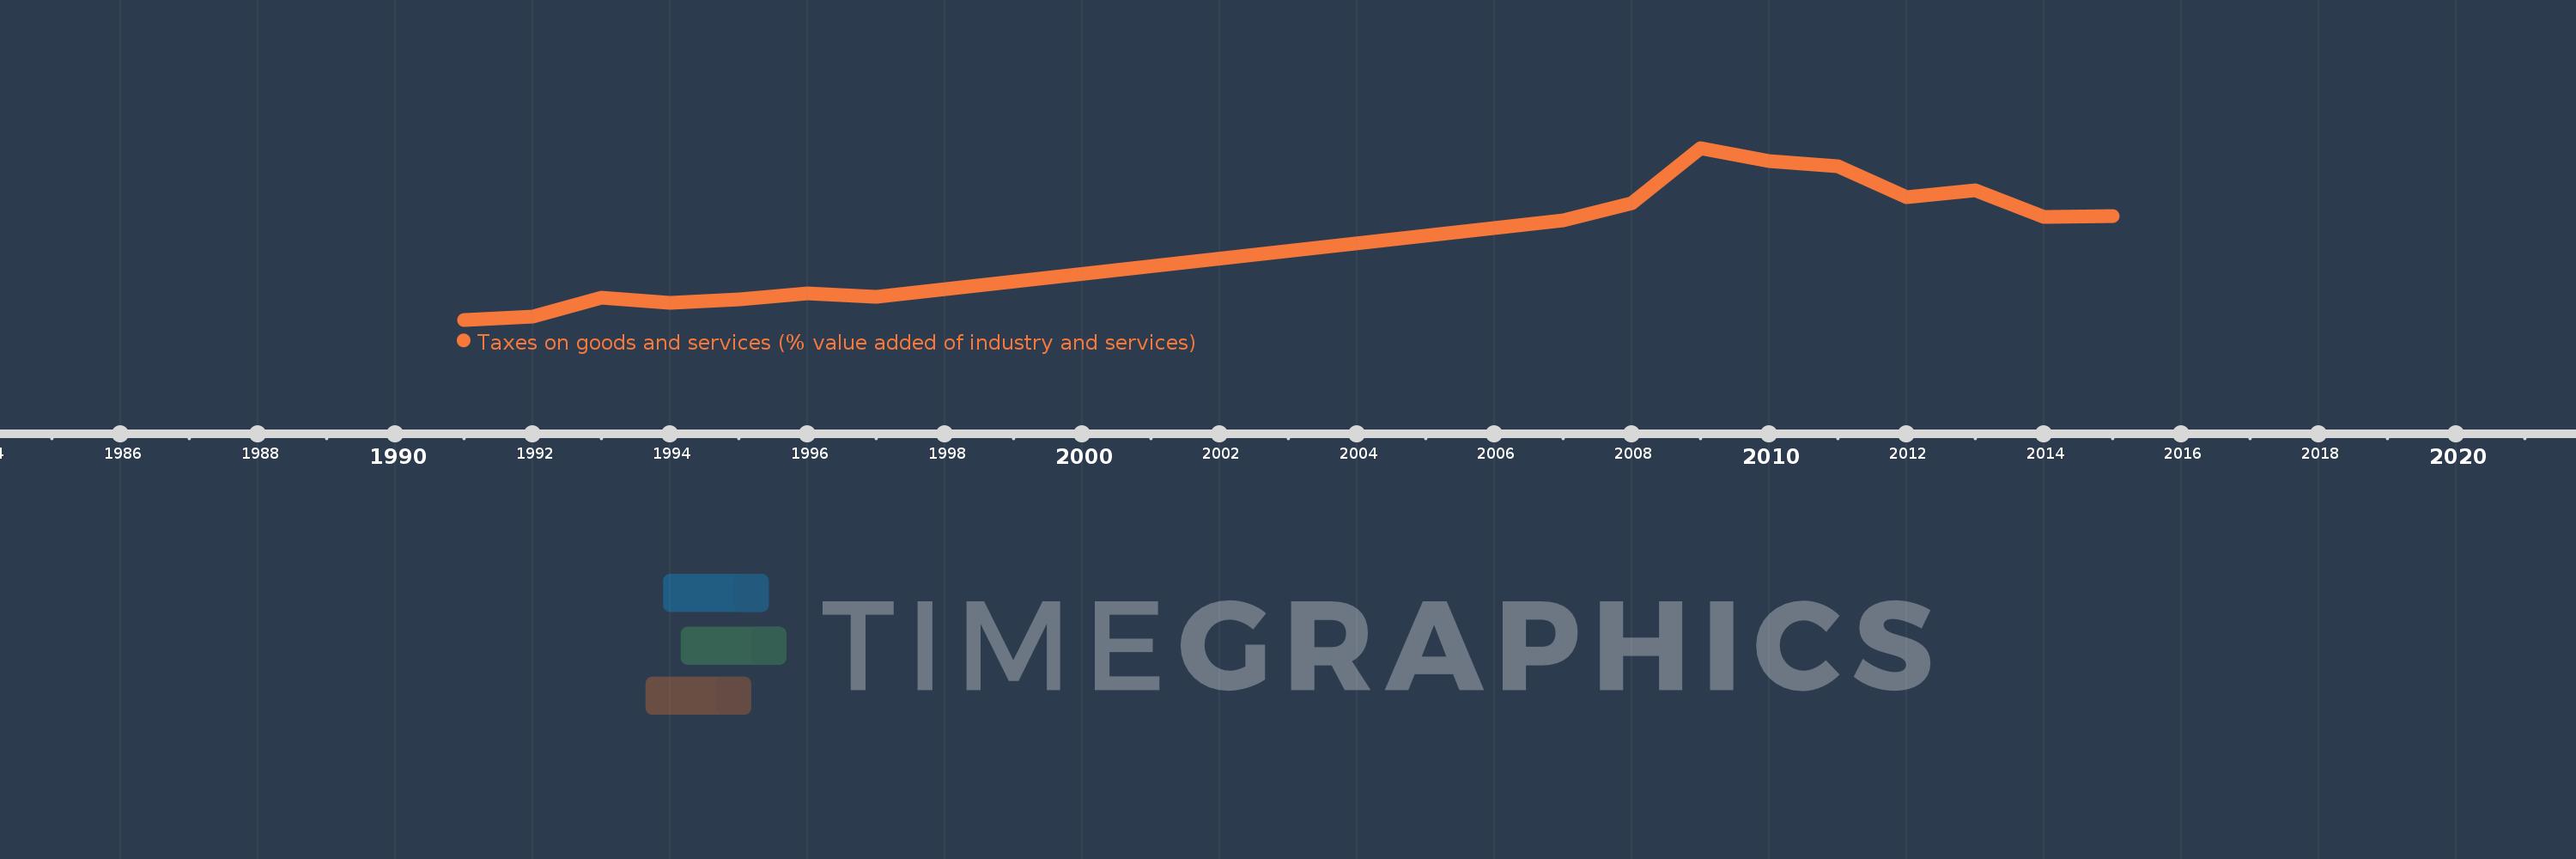
Questa scala temporale mostra un grafico dal 1991 anno al 2015 anno. Botswana. I dati fino ad 1990 anno non disponibili. Il numero di osservazioni attuali secondo i date: 16.
La fonte (nome):
Indicatori dello sviluppo mondiale
La fonte (organizzazione):
International Monetary Fund, Government Finance Statistics Yearbook and data files, and World Bank and OECD value added estimates.
Categorie:
Public Sector
sono stati aggiornati
23 apr 2017 anni
Indicatori delle variazioni dei valori per anni
In media:
3.898
Minima:
1.12
1 gen 1991 anni
Massimo:
7.134
1 gen 2009 anni
Alla data di osservazione
Valore
Variazione assoluta
La variazione rispetto al valore precedente
1 gen 1991 anni
1.12
+1.12
0.0%
1 gen 1992 anni
1.219
+0.098
8.79%
1 gen 1993 anni
1.89
+0.671
55.09%
1 gen 1994 anni
1.722
-0.168
-8.9%
1 gen 1995 anni
1.823
+0.101
5.87%
1 gen 1996 anni
2.052
+0.229
12.57%
1 gen 1997 anni
1.913
-0.139
-6.79%
1 gen 2007 anni
4.604
+2.691
140.69%
1 gen 2008 anni
5.198
+0.595
12.92%
1 gen 2009 anni
7.134
+1.936
37.24%
1 gen 2010 anni
6.671
-0.463
-6.49%
1 gen 2011 anni
6.492
-0.179
-2.68%
1 gen 2012 anni
5.41
-1.083
-16.68%
1 gen 2013 anni
5.646
+0.237
4.37%
1 gen 2014 anni
4.719
-0.927
-16.42%
1 gen 2015 anni
4.749
+0.03
0.64%
Classificazione dei paesi secondo i statistiche attuali per anni