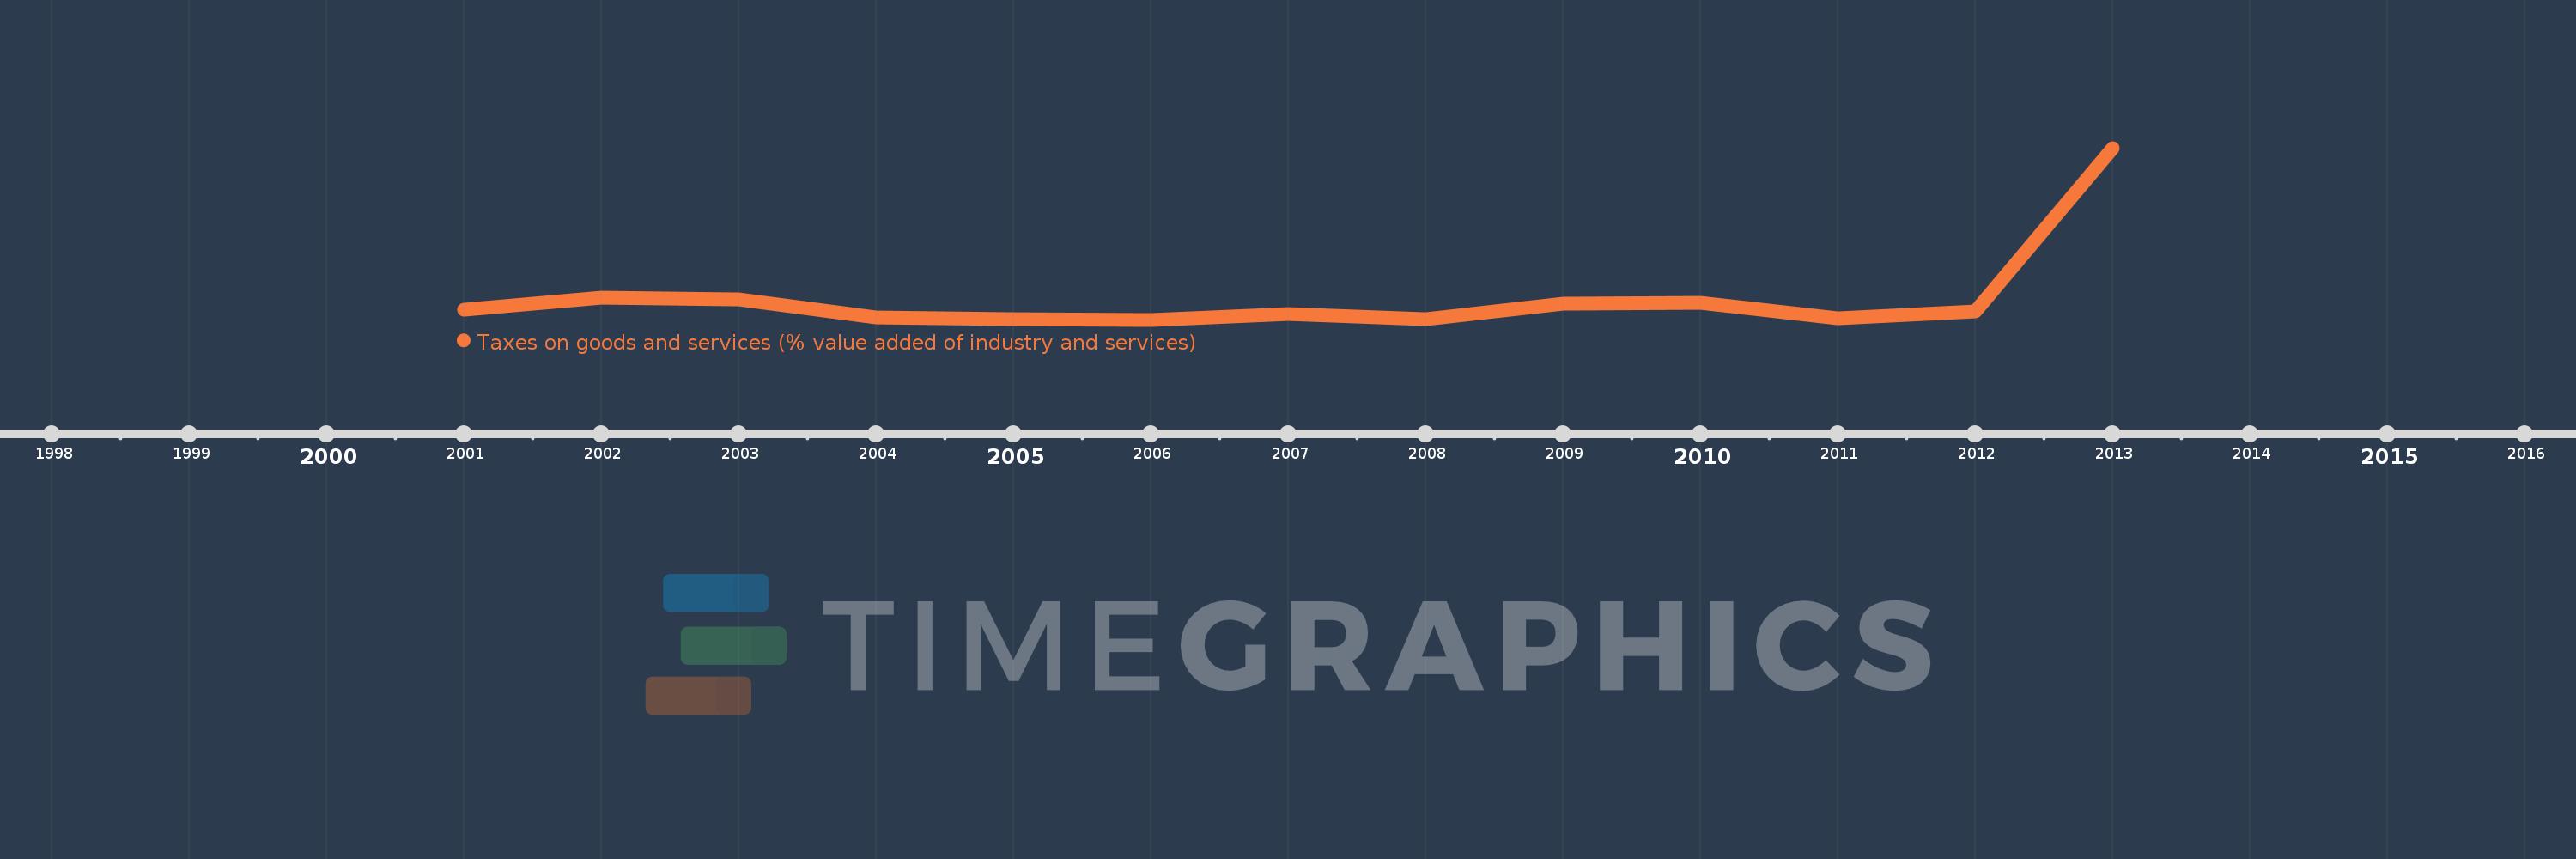
Questa scala temporale mostra un grafico dal 2001 anno al 2013 anno. Swaziland. I dati fino ad 2000 anno non disponibili. Il numero di osservazioni attuali secondo i date: 13.
La fonte (nome):
Indicatori dello sviluppo mondiale
La fonte (organizzazione):
International Monetary Fund, Government Finance Statistics Yearbook and data files, and World Bank and OECD value added estimates.
Categorie:
Public Sector
sono stati aggiornati
23 apr 2017 anni
Indicatori delle variazioni dei valori per anni
In media:
1.386
Minima:
0.747
1 gen 2006 anni
Massimo:
5.908
1 gen 2013 anni
Alla data di osservazione
Valore
Variazione assoluta
La variazione rispetto al valore precedente
1 gen 2001 anni
1.04
+1.04
0.0%
1 gen 2002 anni
1.405
+0.365
35.1%
1 gen 2003 anni
1.351
-0.054
-3.82%
1 gen 2004 anni
0.805
-0.546
-40.43%
1 gen 2005 anni
0.775
-0.03
-3.69%
1 gen 2006 anni
0.747
-0.028
-3.66%
1 gen 2007 anni
0.926
+0.18
24.05%
1 gen 2008 anni
0.772
-0.155
-16.7%
1 gen 2009 anni
1.241
+0.47
60.87%
1 gen 2010 anni
1.251
+0.01
0.79%
1 gen 2011 anni
0.793
-0.458
-36.57%
1 gen 2012 anni
1.001
+0.208
26.21%
1 gen 2013 anni
5.908
+4.907
489.92%
Classificazione dei paesi secondo i statistiche attuali per anni