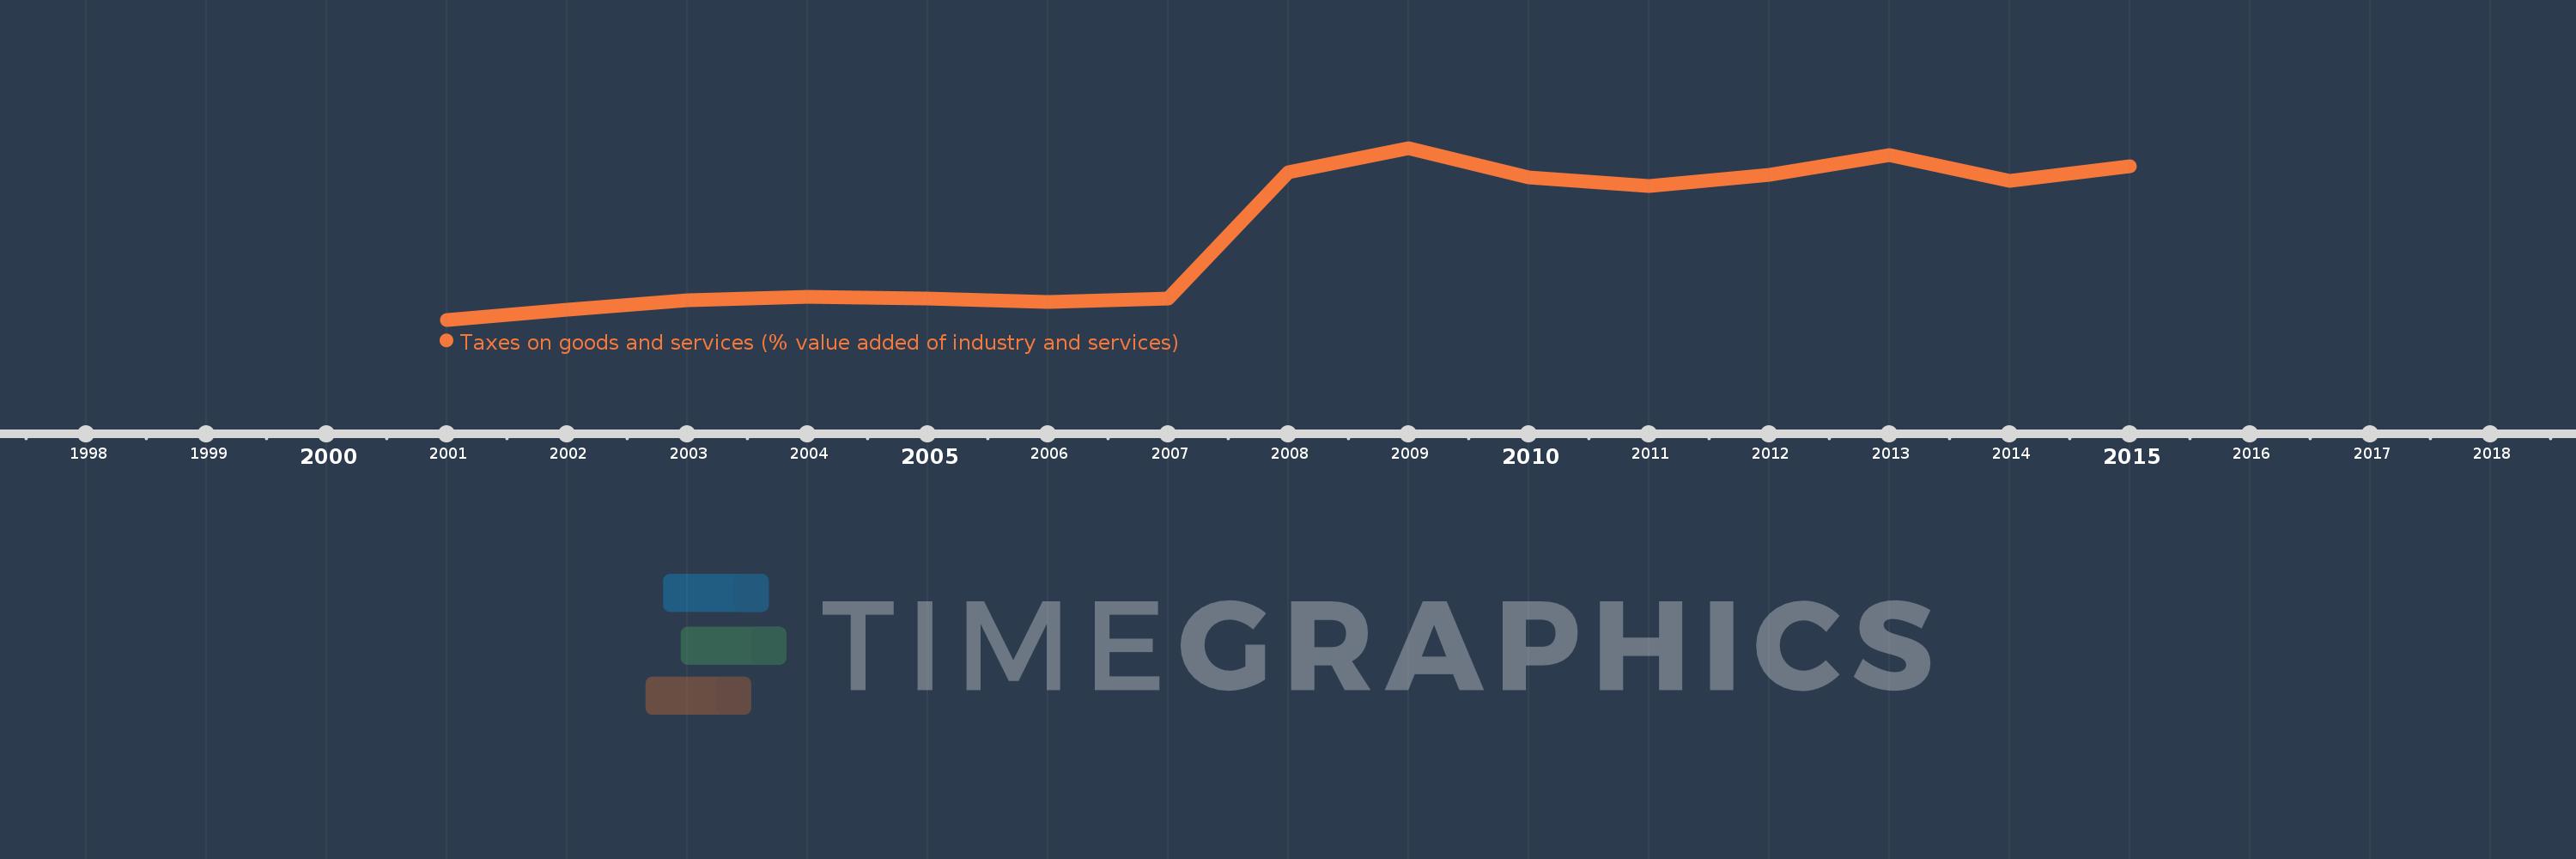
Questa scala temporale mostra un grafico dal 2001 anno al 2015 anno. Antigua and Barbuda. I dati fino ad 2000 anno non disponibili. Il numero di osservazioni attuali secondo i date: 15.
La fonte (nome):
Indicatori dello sviluppo mondiale
La fonte (organizzazione):
International Monetary Fund, Government Finance Statistics Yearbook and data files, and World Bank and OECD value added estimates.
Categorie:
Public Sector
sono stati aggiornati
23 apr 2017 anni
Indicatori delle variazioni dei valori per anni
In media:
6.348
Minima:
2.037
1 gen 2001 anni
Massimo:
10.505
1 gen 2009 anni
Alla data di osservazione
Valore
Variazione assoluta
La variazione rispetto al valore precedente
1 gen 2001 anni
2.037
+2.037
0.0%
1 gen 2002 anni
2.537
+0.5
24.54%
1 gen 2003 anni
3.017
+0.48
18.93%
1 gen 2004 anni
3.165
+0.148
4.9%
1 gen 2005 anni
3.076
-0.089
-2.82%
1 gen 2006 anni
2.924
-0.152
-4.93%
1 gen 2007 anni
3.09
+0.165
5.65%
1 gen 2008 anni
9.327
+6.238
201.9%
1 gen 2009 anni
10.505
+1.178
12.63%
1 gen 2010 anni
9.069
-1.436
-13.67%
1 gen 2011 anni
8.644
-0.426
-4.69%
1 gen 2012 anni
9.188
+0.545
6.3%
1 gen 2013 anni
10.15
+0.961
10.46%
1 gen 2014 anni
8.887
-1.263
-12.44%
1 gen 2015 anni
9.599
+0.712
8.02%
Classificazione dei paesi secondo i statistiche attuali per anni