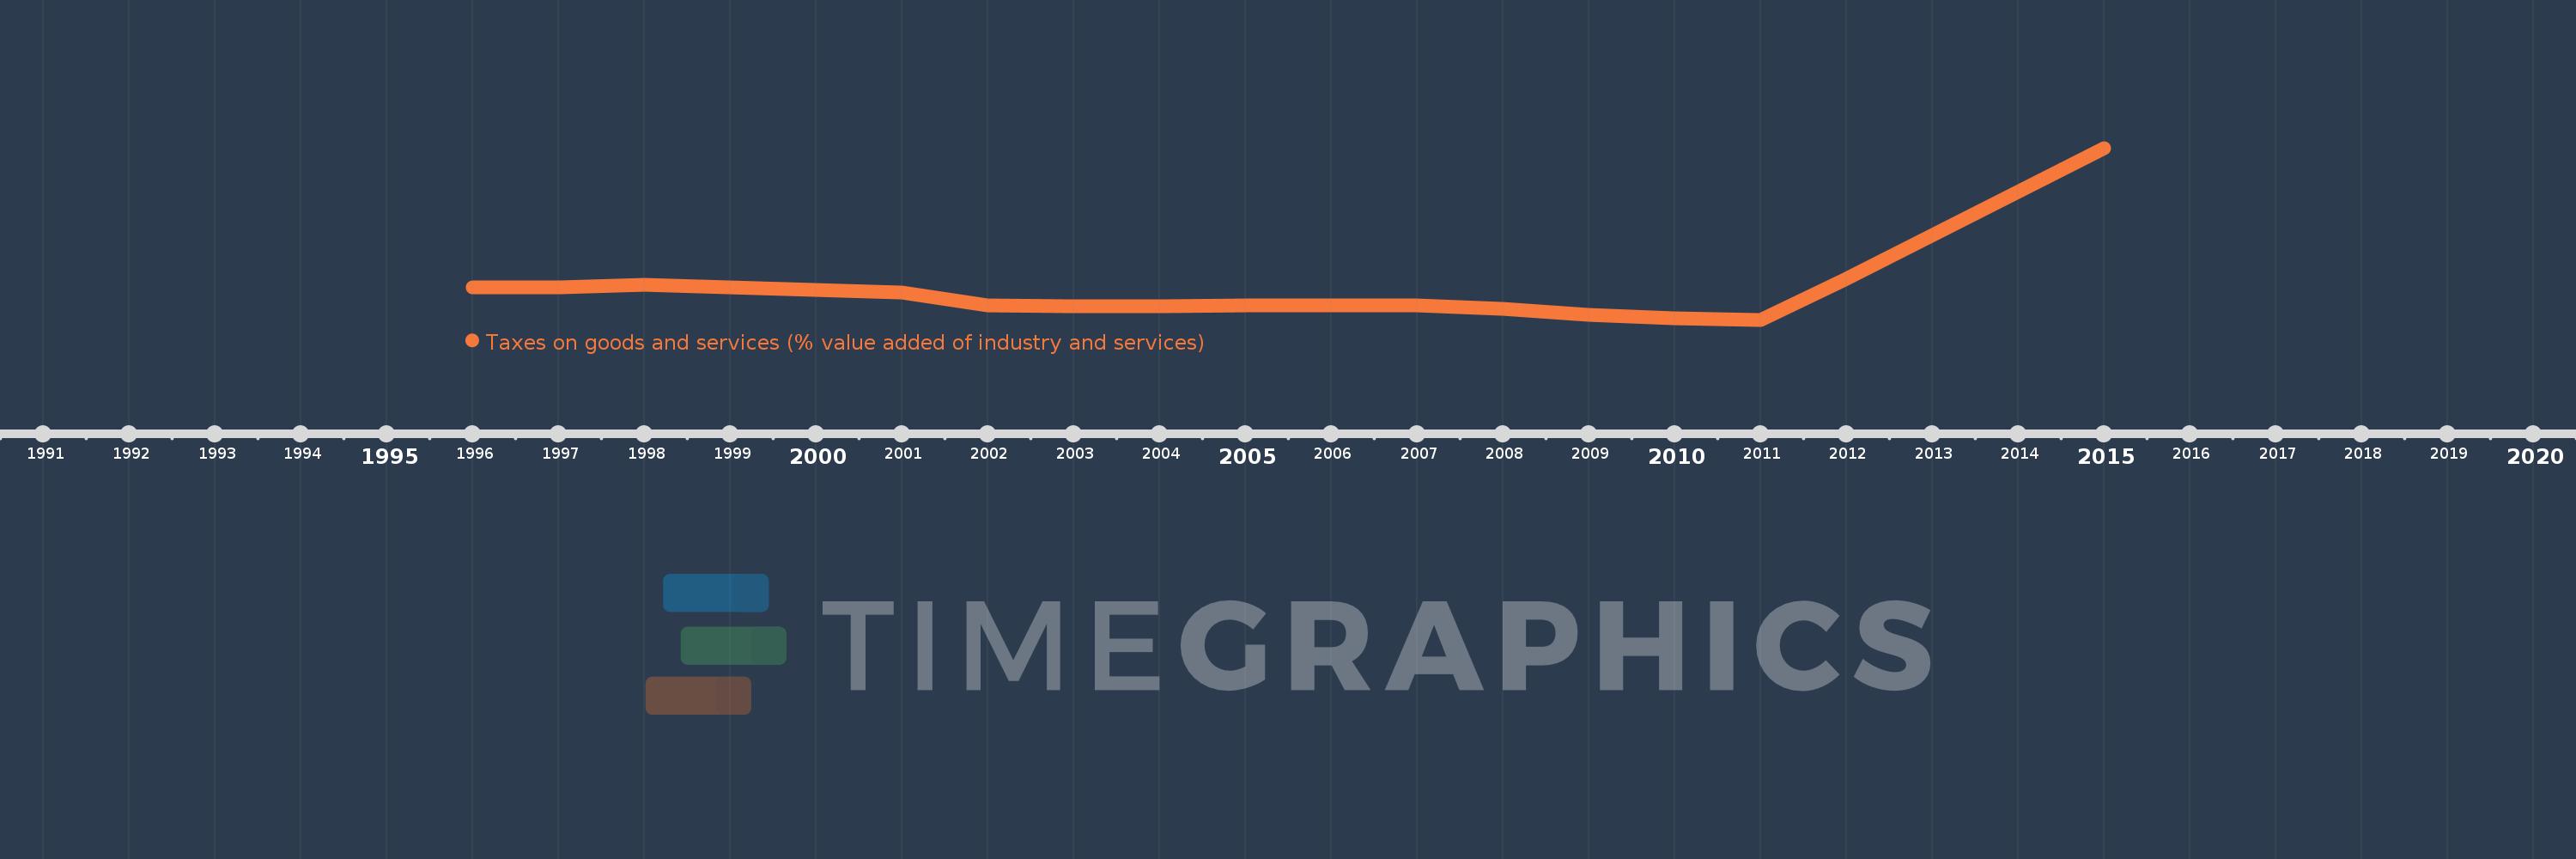
Questa scala temporale mostra un grafico dal 1996 anno al 2015 anno. Maldives. I dati fino ad 1995 anno non disponibili. Il numero di osservazioni attuali secondo i date: 17.
La fonte (nome):
Indicatori dello sviluppo mondiale
La fonte (organizzazione):
International Monetary Fund, Government Finance Statistics Yearbook and data files, and World Bank and OECD value added estimates.
Categorie:
Public Sector
sono stati aggiornati
23 apr 2017 anni
Indicatori delle variazioni dei valori per anni
In media:
4.588
Minima:
2.43
1 gen 2011 anni
Massimo:
15.329
1 gen 2015 anni
Alla data di osservazione
Valore
Variazione assoluta
La variazione rispetto al valore precedente
1 gen 1996 anni
4.842
+4.842
0.0%
1 gen 1997 anni
4.856
+0.015
0.31%
1 gen 1998 anni
5.059
+0.202
4.17%
1 gen 1999 anni
4.863
-0.196
-3.88%
1 gen 2000 anni
4.694
-0.169
-3.47%
1 gen 2001 anni
4.488
-0.206
-4.39%
1 gen 2002 anni
3.508
-0.98
-21.83%
1 gen 2003 anni
3.425
-0.084
-2.38%
1 gen 2004 anni
3.454
+0.029
0.85%
1 gen 2005 anni
3.482
+0.029
0.83%
1 gen 2007 anni
3.519
+0.037
1.06%
1 gen 2008 anni
3.264
-0.256
-7.27%
1 gen 2009 anni
2.791
-0.473
-14.49%
1 gen 2010 anni
2.511
-0.28
-10.02%
1 gen 2011 anni
2.43
-0.081
-3.23%
1 gen 2012 anni
5.479
+3.049
125.47%
1 gen 2015 anni
15.329
+9.85
179.78%
Classificazione dei paesi secondo i statistiche attuali per anni