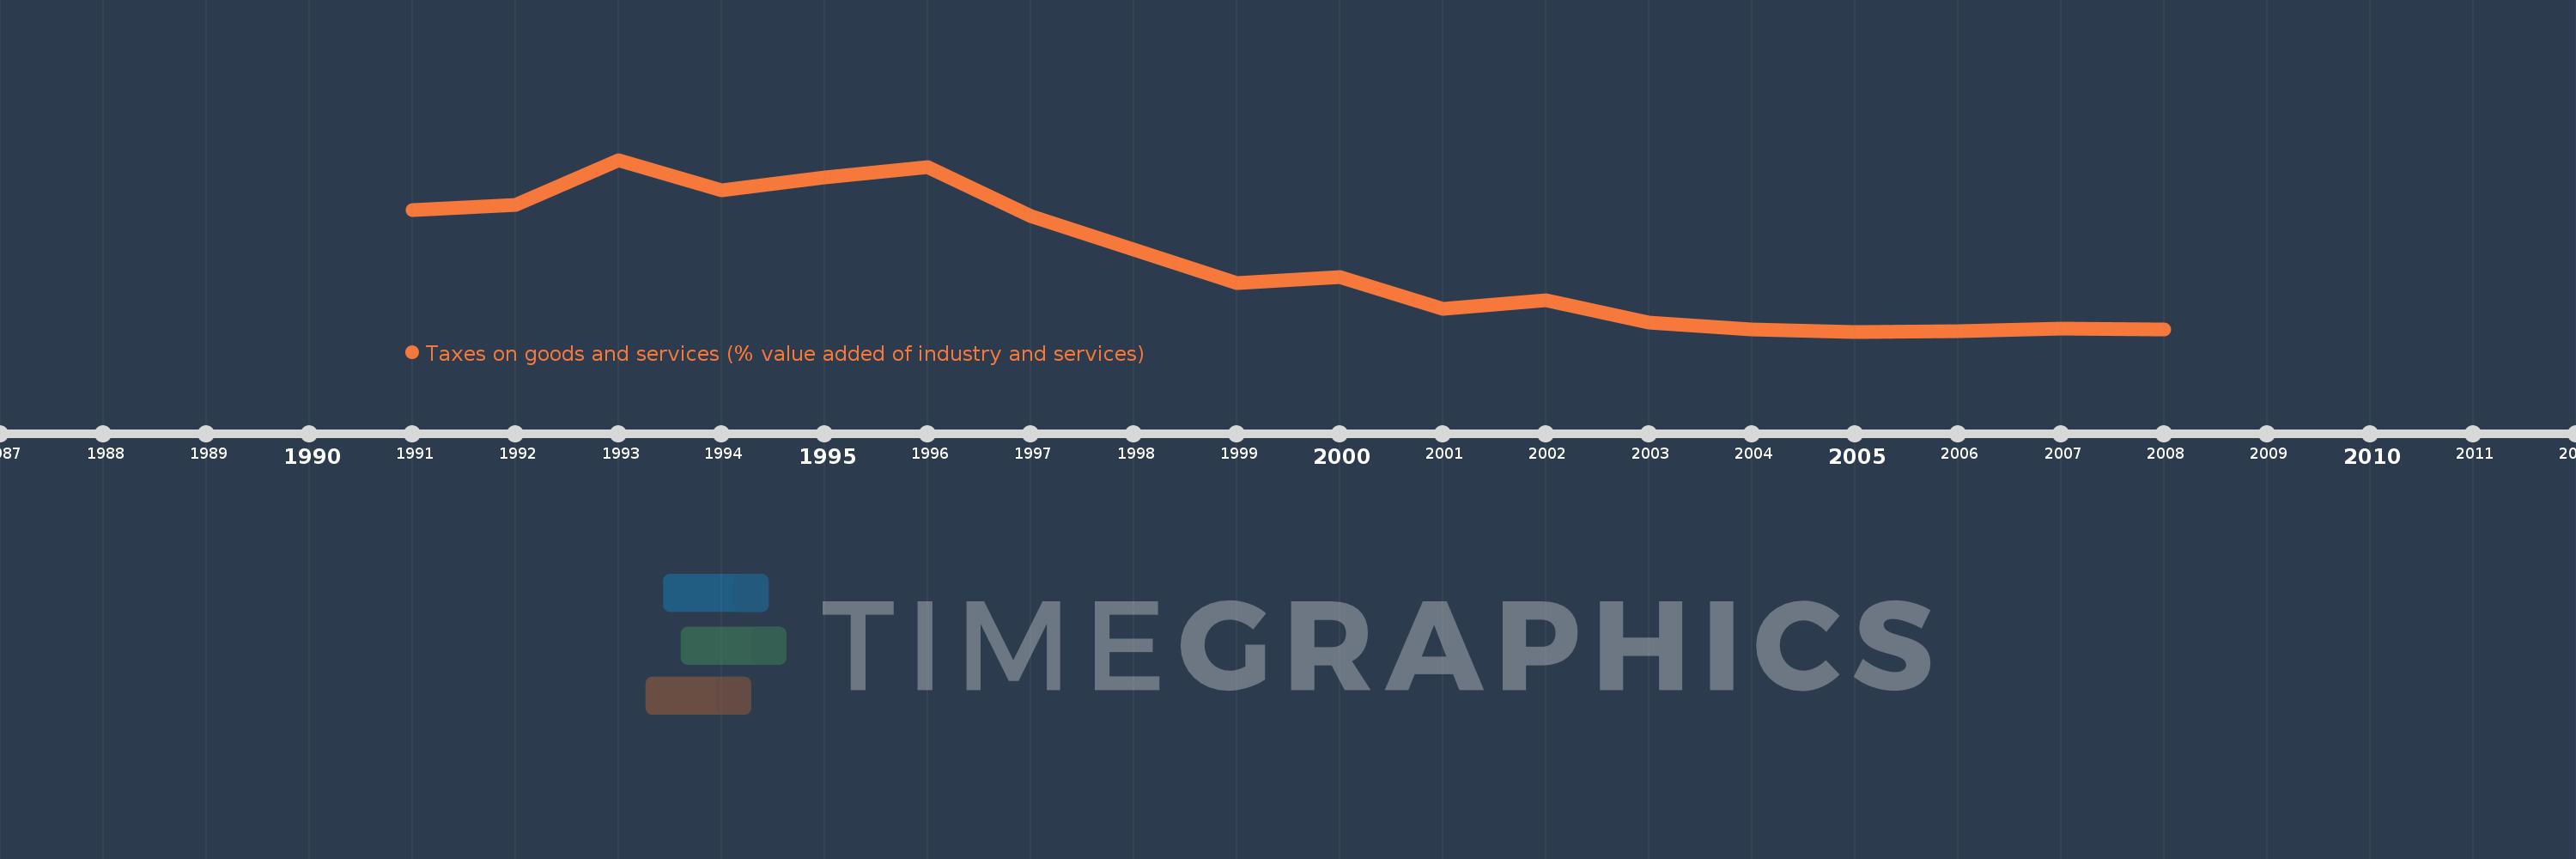
Questa scala temporale mostra un grafico dal 1991 anno al 2008 anno. Syrian Arab Republic. I dati fino ad 1990 anno non disponibili. Il numero di osservazioni attuali secondo i date: 17.
La fonte (nome):
Indicatori dello sviluppo mondiale
La fonte (organizzazione):
International Monetary Fund, Government Finance Statistics Yearbook and data files, and World Bank and OECD value added estimates.
Categorie:
Public Sector
sono stati aggiornati
23 apr 2017 anni
Indicatori delle variazioni dei valori per anni
In media:
5.978
Minima:
0.334
1 gen 2005 anni
Massimo:
14.413
1 gen 1993 anni
Alla data di osservazione
Valore
Variazione assoluta
La variazione rispetto al valore precedente
1 gen 1991 anni
10.327
+10.327
0.0%
1 gen 1992 anni
10.748
+0.421
4.08%
1 gen 1993 anni
14.413
+3.665
34.1%
1 gen 1994 anni
11.927
-2.486
-17.25%
1 gen 1995 anni
12.977
+1.05
8.8%
1 gen 1996 anni
13.839
+0.862
6.64%
1 gen 1997 anni
9.817
-4.022
-29.06%
1 gen 1999 anni
4.281
-5.537
-56.4%
1 gen 2000 anni
4.833
+0.552
12.9%
1 gen 2001 anni
2.188
-2.645
-54.73%
1 gen 2002 anni
2.898
+0.71
32.45%
1 gen 2003 anni
1.101
-1.797
-62.0%
1 gen 2004 anni
0.498
-0.603
-54.74%
1 gen 2005 anni
0.334
-0.164
-33.0%
1 gen 2006 anni
0.348
+0.015
4.35%
1 gen 2007 anni
0.587
+0.239
68.51%
1 gen 2008 anni
0.507
-0.08
-13.63%
Classificazione dei paesi secondo i statistiche attuali per anni