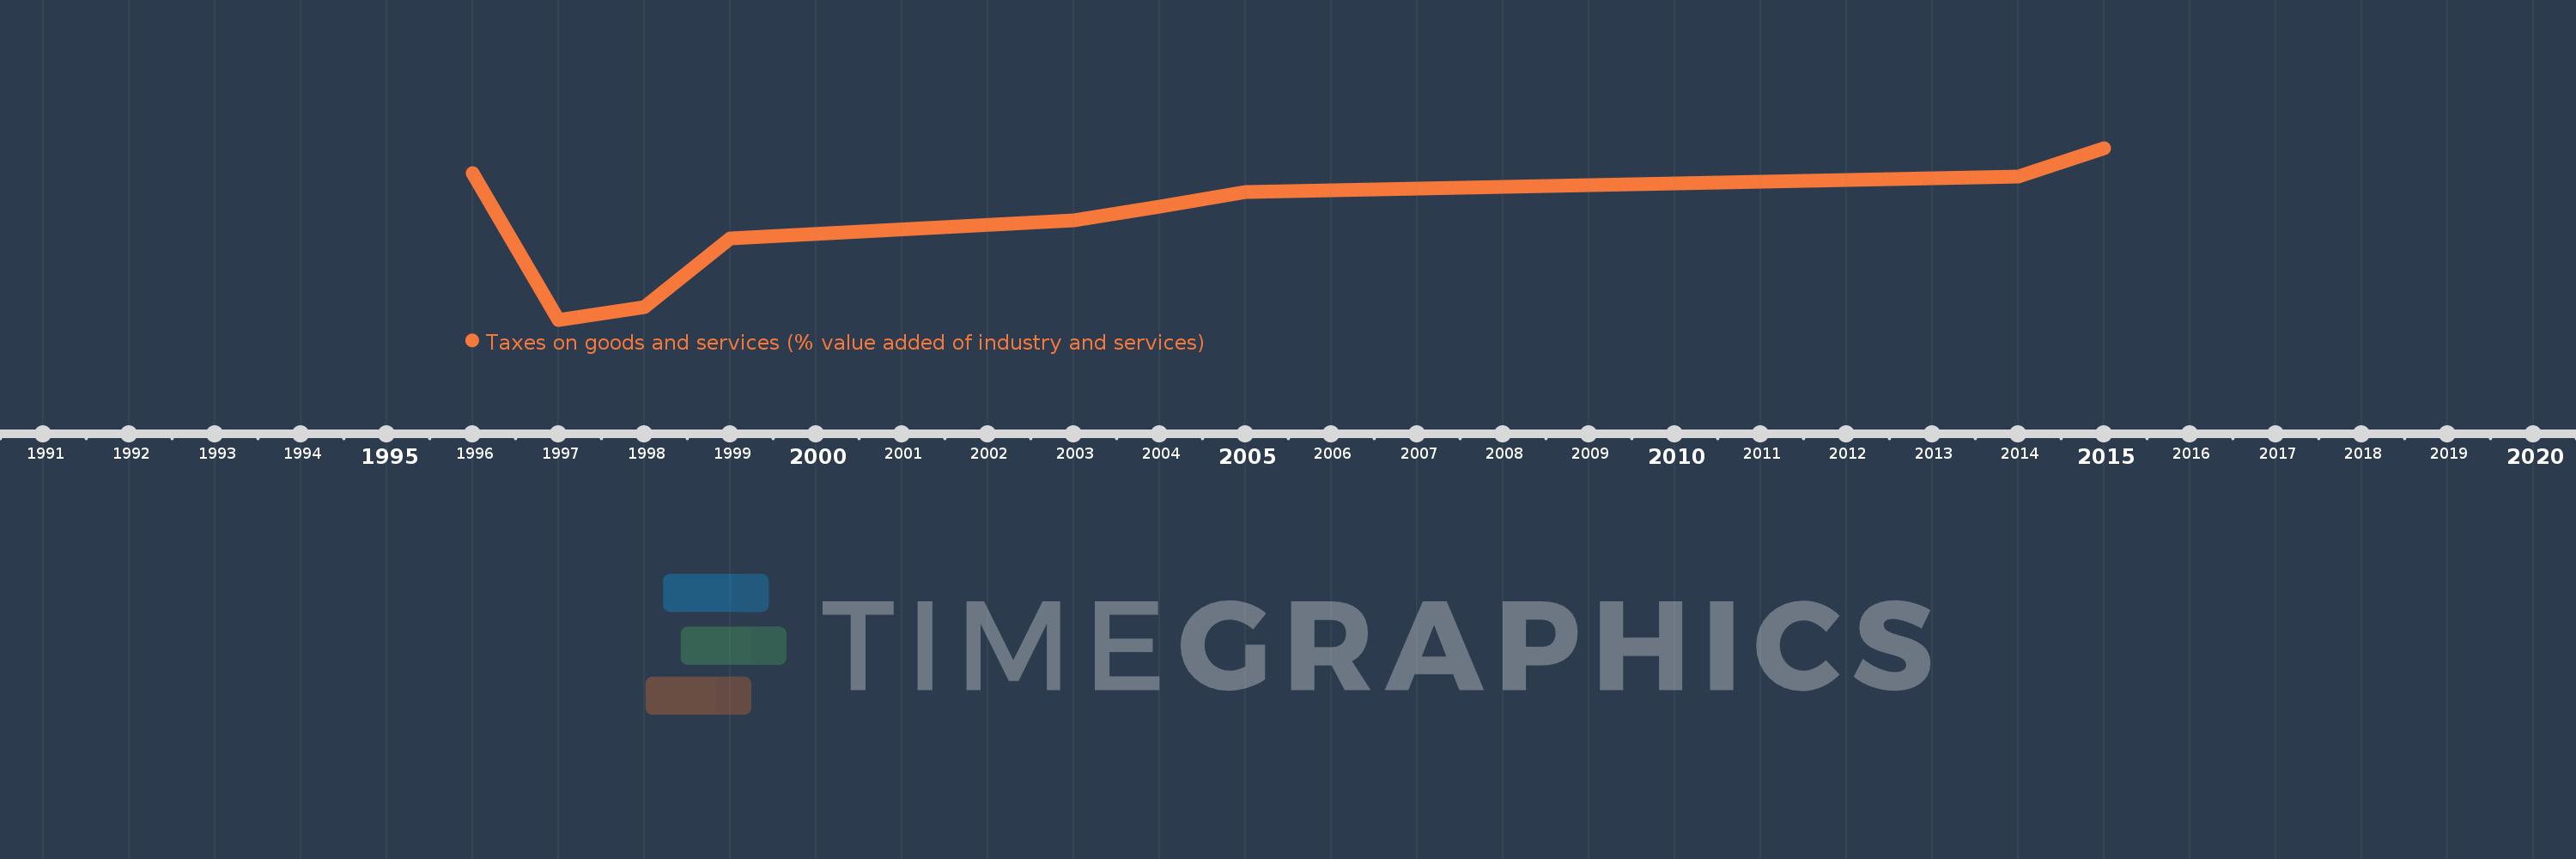
Questa scala temporale mostra un grafico dal 1996 anno al 2015 anno. Albania. I dati fino ad 1995 anno non disponibili. Il numero di osservazioni attuali secondo i date: 9.
La fonte (nome):
Indicatori dello sviluppo mondiale
La fonte (organizzazione):
International Monetary Fund, Government Finance Statistics Yearbook and data files, and World Bank and OECD value added estimates.
Categorie:
Public Sector
sono stati aggiornati
23 apr 2017 anni
Indicatori delle variazioni dei valori per anni
In media:
15.407
Minima:
7.853
1 gen 1997 anni
Massimo:
20.895
1 gen 2015 anni
Alla data di osservazione
Valore
Variazione assoluta
La variazione rispetto al valore precedente
1 gen 1996 anni
18.981
+18.981
0.0%
1 gen 1997 anni
7.853
-11.128
-58.63%
1 gen 1998 anni
8.8
+0.947
12.06%
1 gen 1999 anni
14.001
+5.202
59.11%
1 gen 2003 anni
15.419
+1.418
10.13%
1 gen 2004 anni
16.456
+1.037
6.72%
1 gen 2005 anni
17.543
+1.087
6.6%
1 gen 2014 anni
18.718
+1.175
6.7%
1 gen 2015 anni
20.895
+2.177
11.63%
Classificazione dei paesi secondo i statistiche attuali per anni