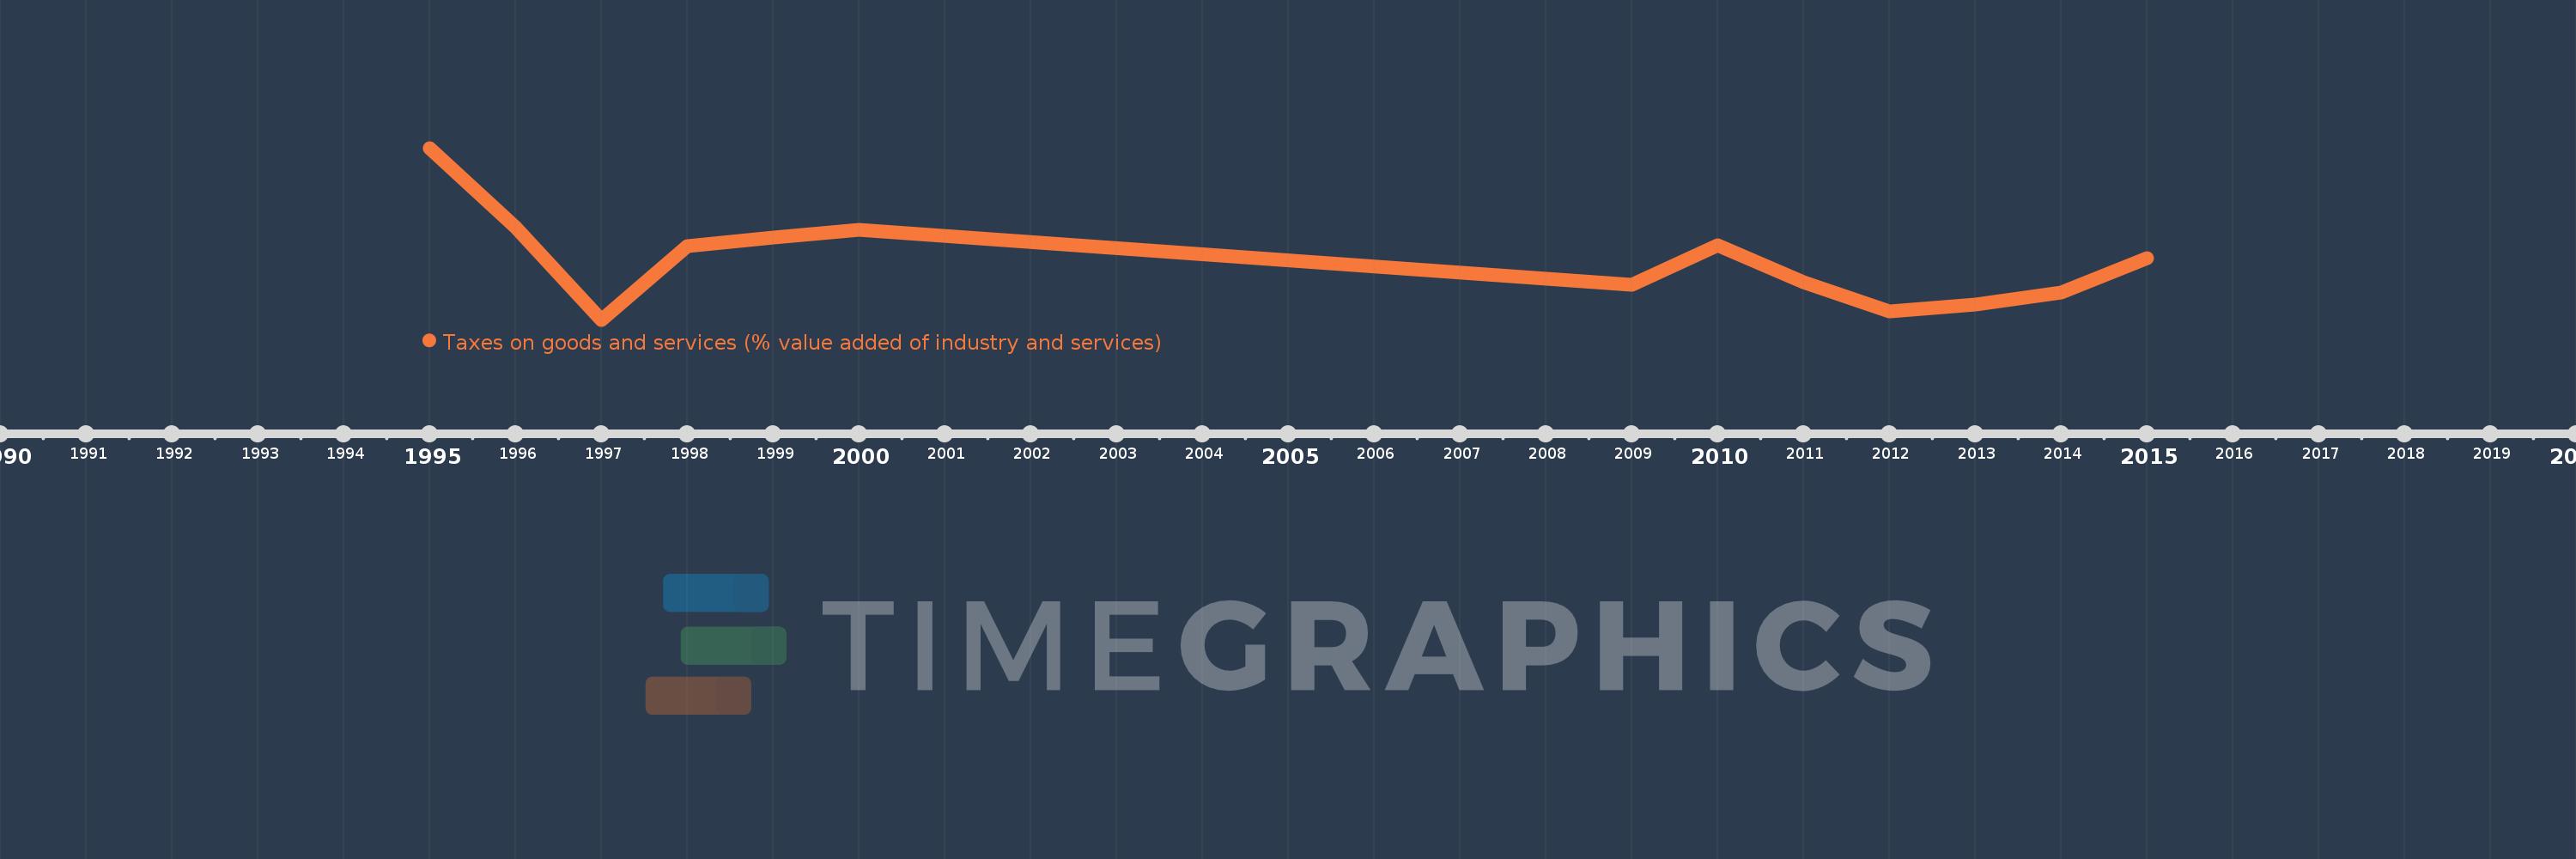
Questa scala temporale mostra un grafico dal 1995 anno al 2015 anno. Azerbaijan. I dati fino ad 1994 anno non disponibili. Il numero di osservazioni attuali secondo i date: 13.
La fonte (nome):
Indicatori dello sviluppo mondiale
La fonte (organizzazione):
International Monetary Fund, Government Finance Statistics Yearbook and data files, and World Bank and OECD value added estimates.
Categorie:
Public Sector
sono stati aggiornati
23 apr 2017 anni
Indicatori delle variazioni dei valori per anni
In media:
7.955
Minima:
5.897
1 gen 1997 anni
Massimo:
11.869
1 gen 1995 anni
Alla data di osservazione
Valore
Variazione assoluta
La variazione rispetto al valore precedente
1 gen 1995 anni
11.869
+11.869
0.0%
1 gen 1996 anni
9.101
-2.767
-23.32%
1 gen 1997 anni
5.897
-3.204
-35.21%
1 gen 1998 anni
8.454
+2.557
43.36%
1 gen 1999 anni
8.769
+0.315
3.73%
1 gen 2000 anni
9.032
+0.262
2.99%
1 gen 2009 anni
7.108
-1.924
-21.3%
1 gen 2010 anni
8.471
+1.363
19.17%
1 gen 2011 anni
7.205
-1.265
-14.94%
1 gen 2012 anni
6.177
-1.028
-14.27%
1 gen 2013 anni
6.432
+0.254
4.12%
1 gen 2014 anni
6.856
+0.425
6.6%
1 gen 2015 anni
8.043
+1.187
17.31%
Classificazione dei paesi secondo i statistiche attuali per anni