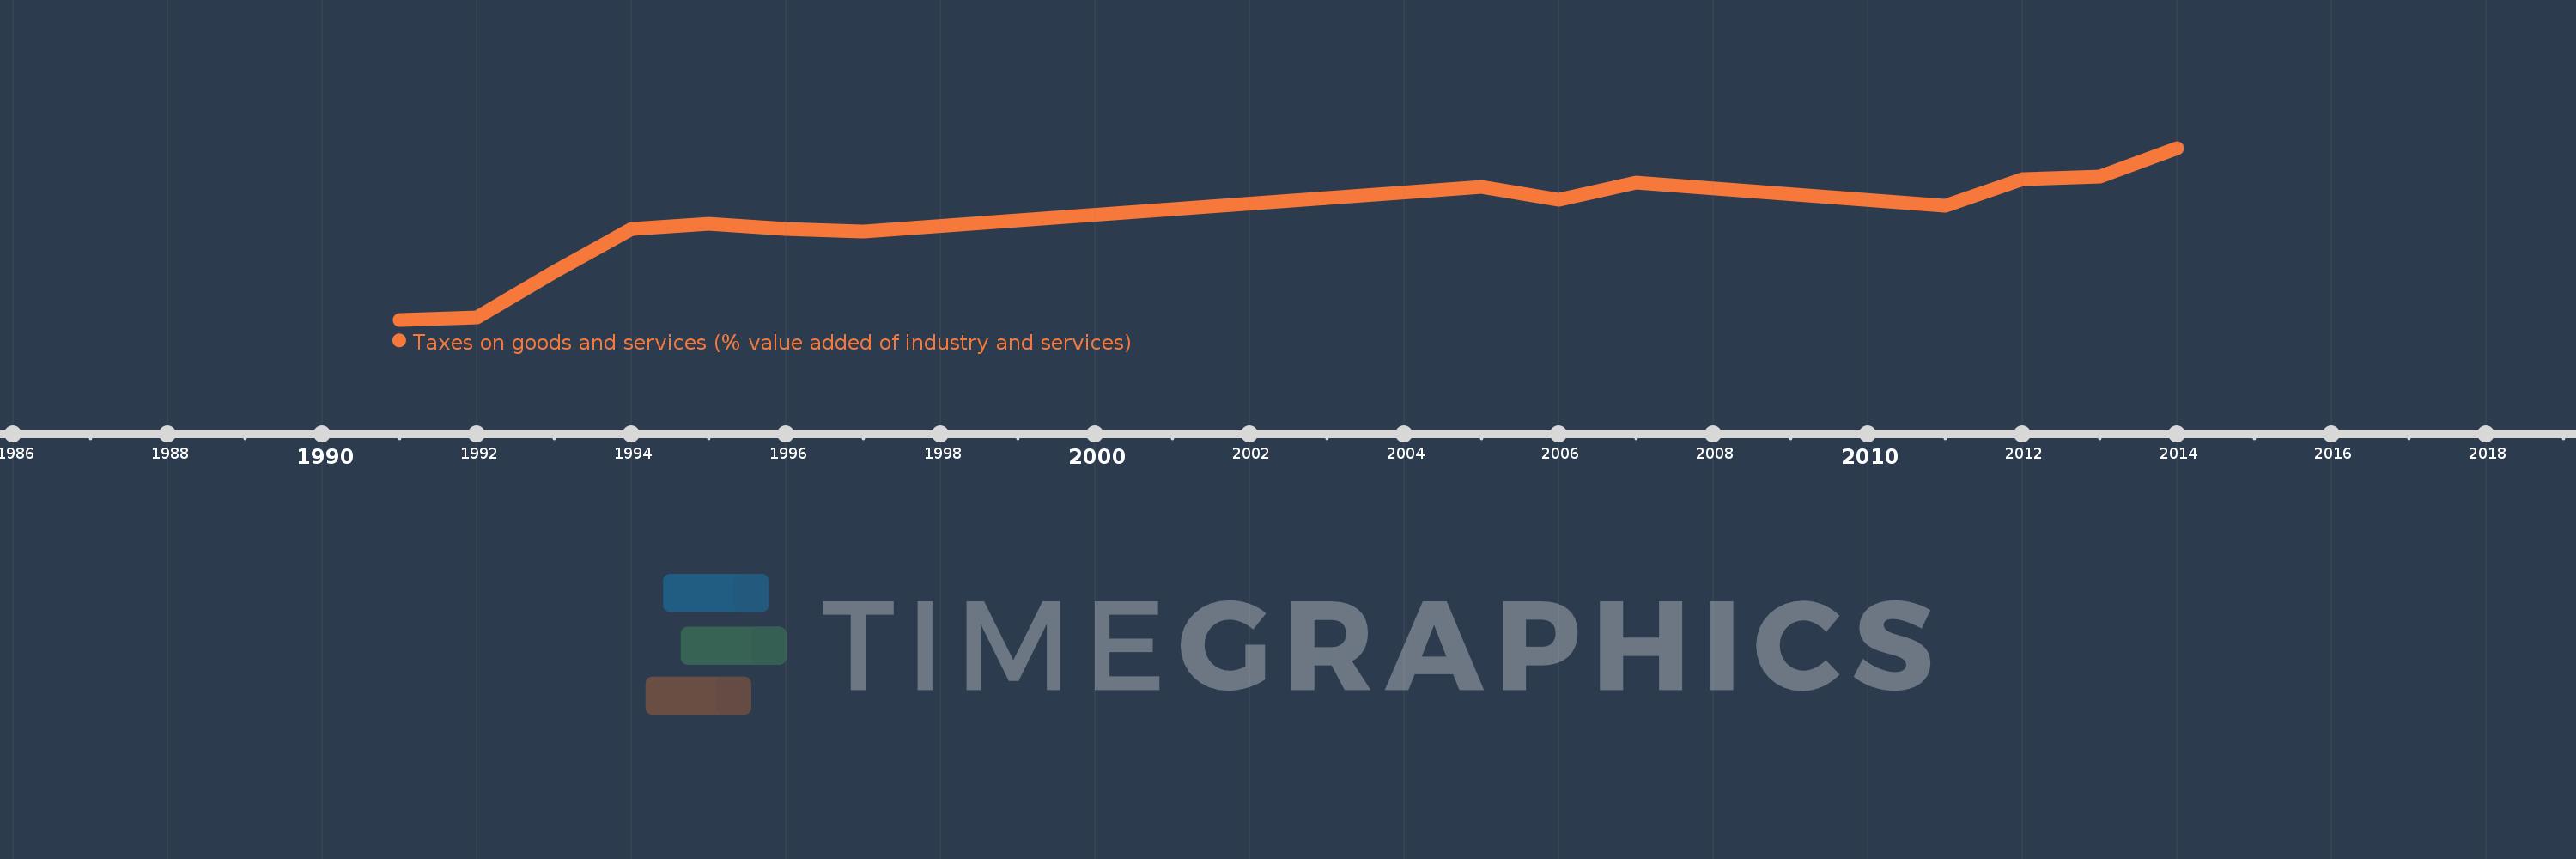
Questa scala temporale mostra un grafico dal 1991 anno al 2014 anno. Fiji. I dati fino ad 1990 anno non disponibili. Il numero di osservazioni attuali secondo i date: 14.
La fonte (nome):
Indicatori dello sviluppo mondiale
La fonte (organizzazione):
International Monetary Fund, Government Finance Statistics Yearbook and data files, and World Bank and OECD value added estimates.
Categorie:
Public Sector
sono stati aggiornati
23 apr 2017 anni
Indicatori delle variazioni dei valori per anni
In media:
12.253
Minima:
5.595
1 gen 1991 anni
Massimo:
17.25
1 gen 2014 anni
Alla data di osservazione
Valore
Variazione assoluta
La variazione rispetto al valore precedente
1 gen 1991 anni
5.595
+5.595
0.0%
1 gen 1992 anni
5.724
+0.129
2.31%
1 gen 1993 anni
8.856
+3.131
54.7%
1 gen 1994 anni
11.73
+2.875
32.47%
1 gen 1995 anni
12.078
+0.347
2.96%
1 gen 1996 anni
11.734
-0.344
-2.85%
1 gen 1997 anni
11.558
-0.176
-1.5%
1 gen 2005 anni
14.61
+3.052
26.41%
1 gen 2006 anni
13.743
-0.867
-5.93%
1 gen 2007 anni
14.919
+1.176
8.56%
1 gen 2011 anni
13.307
-1.613
-10.81%
1 gen 2012 anni
15.149
+1.843
13.85%
1 gen 2013 anni
15.288
+0.138
0.91%
1 gen 2014 anni
17.25
+1.962
12.83%
Classificazione dei paesi secondo i statistiche attuali per anni