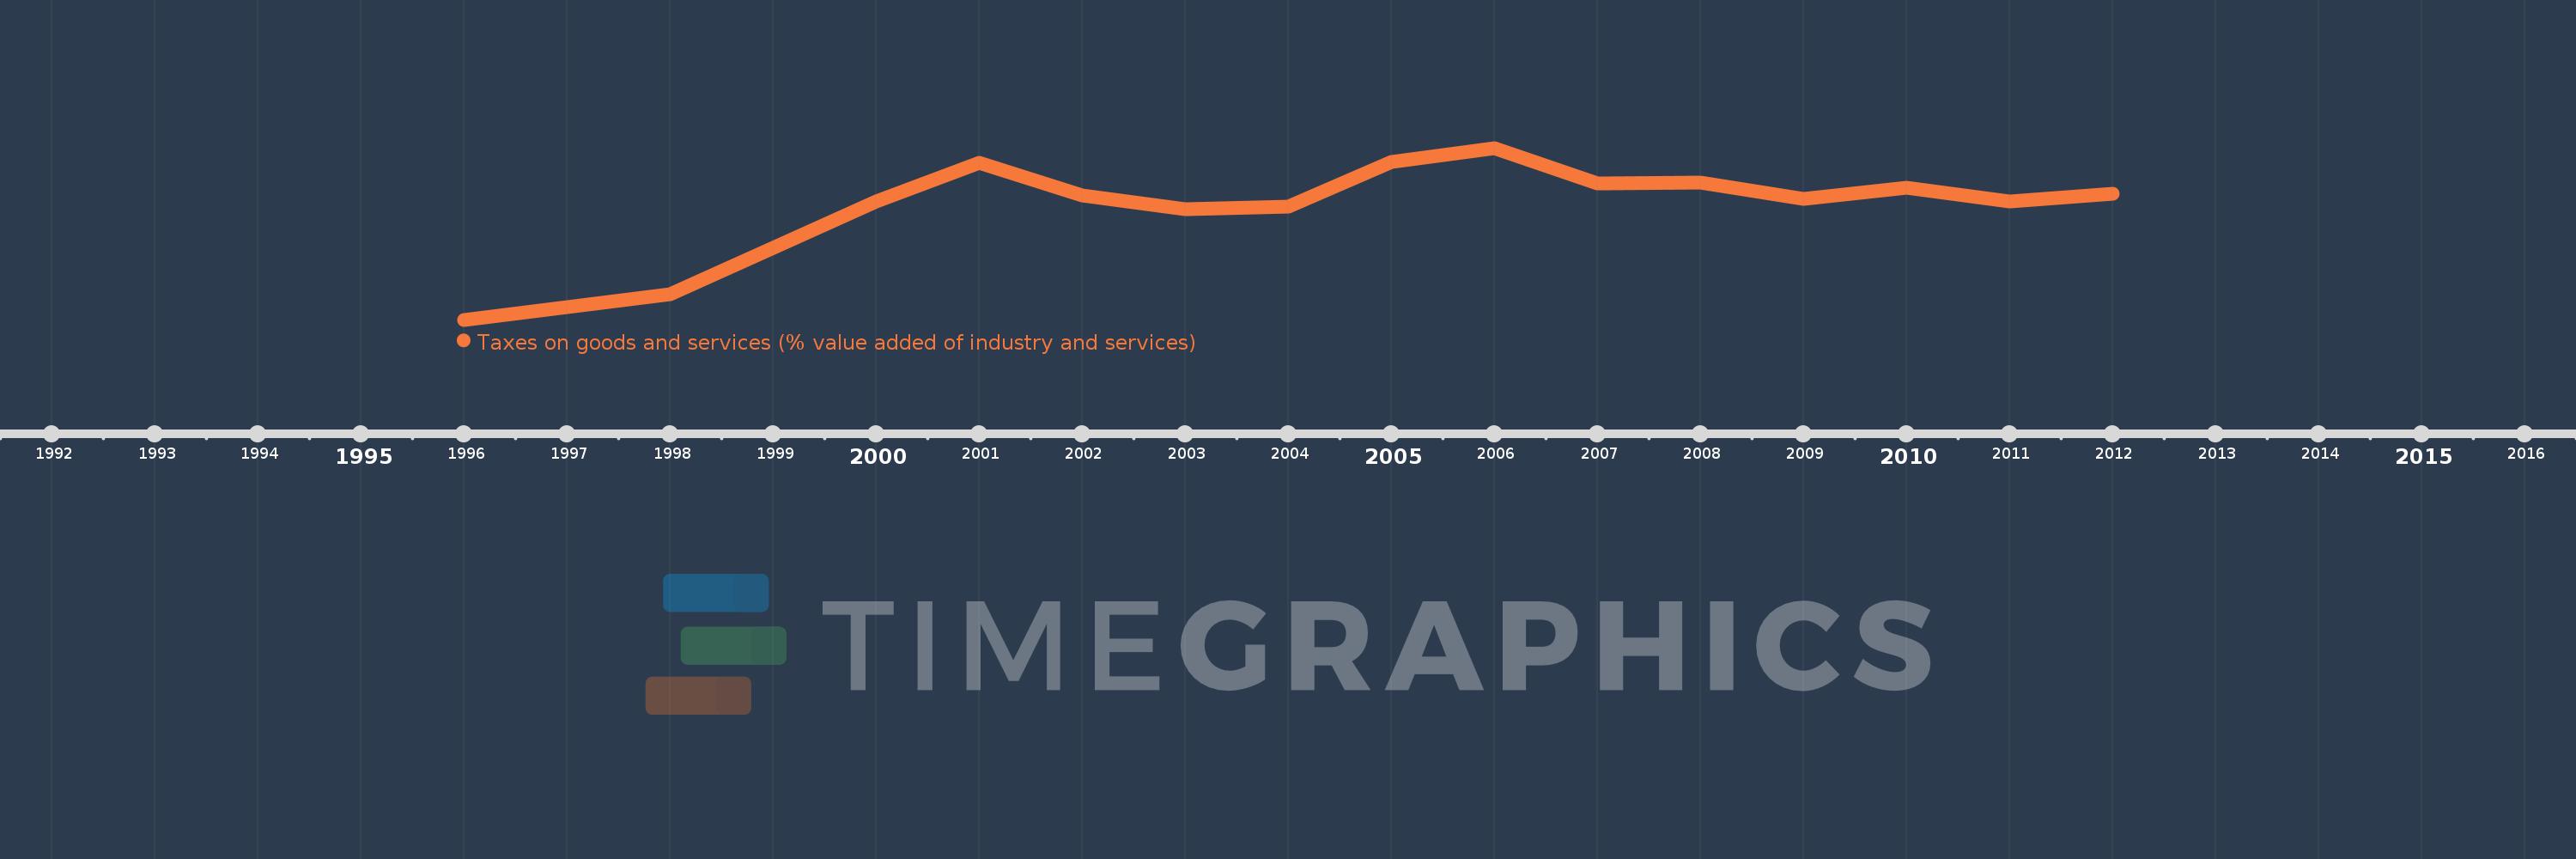
Questa scala temporale mostra un grafico dal 1996 anno al 2012 anno. Luxembourg. I dati fino ad 1995 anno non disponibili. Il numero di osservazioni attuali secondo i date: 16.
La fonte (nome):
Indicatori dello sviluppo mondiale
La fonte (organizzazione):
International Monetary Fund, Government Finance Statistics Yearbook and data files, and World Bank and OECD value added estimates.
Categorie:
Public Sector
sono stati aggiornati
23 apr 2017 anni
Indicatori delle variazioni dei valori per anni
In media:
13.512
Minima:
10.713
1 gen 1996 anni
Massimo:
15.081
1 gen 2006 anni
Alla data di osservazione
Valore
Variazione assoluta
La variazione rispetto al valore precedente
1 gen 1996 anni
10.713
+10.713
0.0%
1 gen 1997 anni
11.026
+0.313
2.92%
1 gen 1998 anni
11.355
+0.33
2.99%
1 gen 2000 anni
13.731
+2.376
20.92%
1 gen 2001 anni
14.695
+0.964
7.02%
1 gen 2002 anni
13.878
-0.817
-5.56%
1 gen 2003 anni
13.534
-0.344
-2.48%
1 gen 2004 anni
13.581
+0.047
0.35%
1 gen 2005 anni
14.723
+1.143
8.41%
1 gen 2006 anni
15.081
+0.357
2.43%
1 gen 2007 anni
14.188
-0.893
-5.92%
1 gen 2008 anni
14.191
+0.003
0.02%
1 gen 2009 anni
13.789
-0.402
-2.84%
1 gen 2010 anni
14.079
+0.29
2.11%
1 gen 2011 anni
13.718
-0.361
-2.57%
1 gen 2012 anni
13.917
+0.199
1.45%
Classificazione dei paesi secondo i statistiche attuali per anni