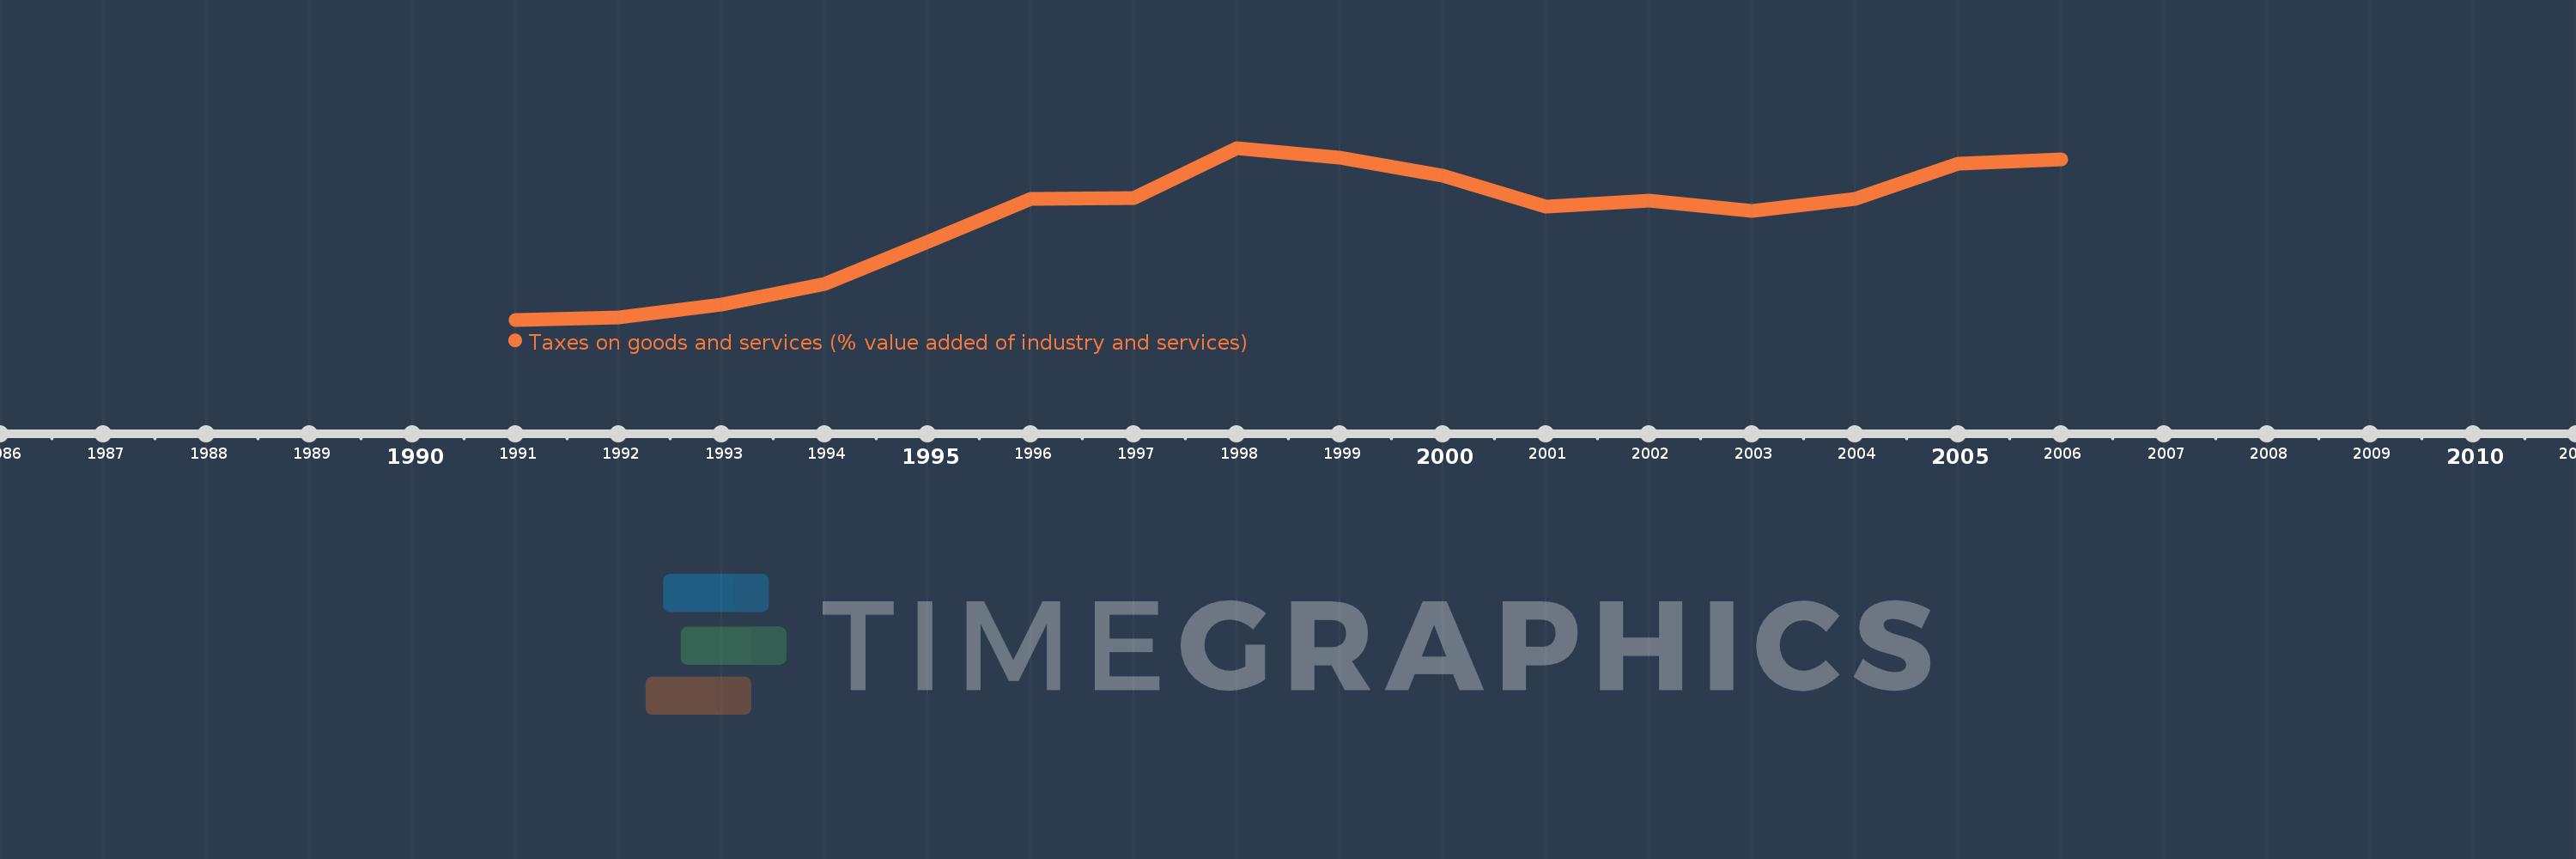
Questa scala temporale mostra un grafico dal 1991 anno al 2006 anno. Venezuela, RB. I dati fino ad 1990 anno non disponibili. Il numero di osservazioni attuali secondo i date: 16.
La fonte (nome):
Indicatori dello sviluppo mondiale
La fonte (organizzazione):
International Monetary Fund, Government Finance Statistics Yearbook and data files, and World Bank and OECD value added estimates.
Categorie:
Public Sector
sono stati aggiornati
23 apr 2017 anni
Indicatori delle variazioni dei valori per anni
In media:
5.383
Minima:
0.835
1 gen 1991 anni
Massimo:
8.504
1 gen 1998 anni
Alla data di osservazione
Valore
Variazione assoluta
La variazione rispetto al valore precedente
1 gen 1991 anni
0.835
+0.835
0.0%
1 gen 1992 anni
0.937
+0.102
12.21%
1 gen 1993 anni
1.51
+0.573
61.19%
1 gen 1994 anni
2.421
+0.911
60.35%
1 gen 1995 anni
4.328
+1.907
78.76%
1 gen 1996 anni
6.222
+1.894
43.76%
1 gen 1997 anni
6.258
+0.036
0.58%
1 gen 1998 anni
8.504
+2.246
35.89%
1 gen 1999 anni
8.067
-0.437
-5.14%
1 gen 2000 anni
7.264
-0.803
-9.95%
1 gen 2001 anni
5.898
-1.367
-18.81%
1 gen 2002 anni
6.149
+0.251
4.26%
1 gen 2003 anni
5.707
-0.442
-7.19%
1 gen 2004 anni
6.242
+0.535
9.37%
1 gen 2005 anni
7.798
+1.557
24.94%
1 gen 2006 anni
7.996
+0.198
2.53%
Classificazione dei paesi secondo i statistiche attuali per anni