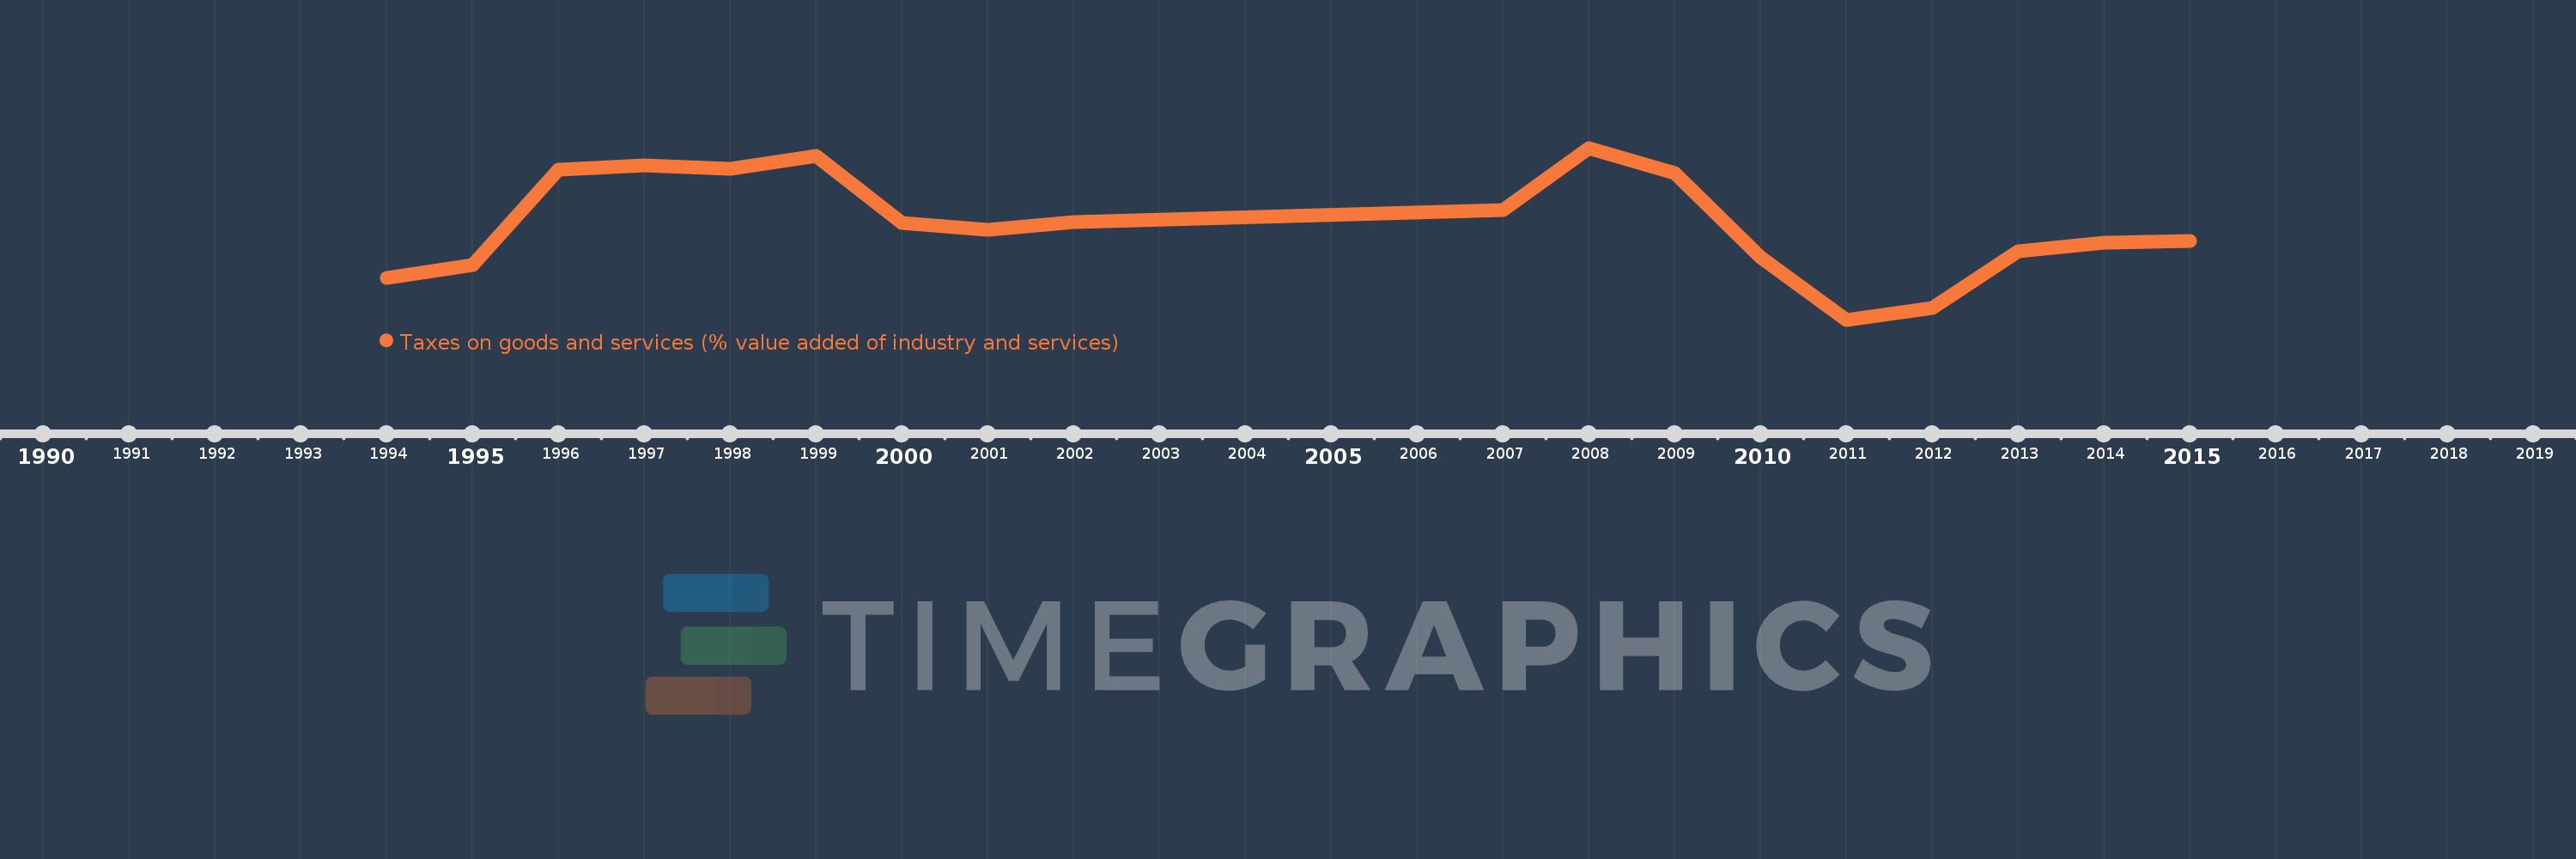
Questa scala temporale mostra un grafico dal 1994 anno al 2015 anno. Kyrgyz Republic. I dati fino ad 1993 anno non disponibili. Il numero di osservazioni attuali secondo i date: 18.
La fonte (nome):
Indicatori dello sviluppo mondiale
La fonte (organizzazione):
International Monetary Fund, Government Finance Statistics Yearbook and data files, and World Bank and OECD value added estimates.
Categorie:
Public Sector
sono stati aggiornati
23 apr 2017 anni
Indicatori delle variazioni dei valori per anni
In media:
15.942
Minima:
11.541
1 gen 2011 anni
Massimo:
19.429
1 gen 2008 anni
Alla data di osservazione
Valore
Variazione assoluta
La variazione rispetto al valore precedente
1 gen 1994 anni
13.466
+13.466
0.0%
1 gen 1995 anni
14.047
+0.582
4.32%
1 gen 1996 anni
18.412
+4.365
31.07%
1 gen 1997 anni
18.628
+0.215
1.17%
1 gen 1998 anni
18.49
-0.138
-0.74%
1 gen 1999 anni
19.062
+0.572
3.1%
1 gen 2000 anni
15.99
-3.073
-16.12%
1 gen 2001 anni
15.655
-0.334
-2.09%
1 gen 2002 anni
16.006
+0.35
2.24%
1 gen 2007 anni
16.577
+0.572
3.57%
1 gen 2008 anni
19.429
+2.852
17.2%
1 gen 2009 anni
18.285
-1.144
-5.89%
1 gen 2010 anni
14.411
-3.874
-21.19%
1 gen 2011 anni
11.541
-2.87
-19.91%
1 gen 2012 anni
12.074
+0.533
4.62%
1 gen 2013 anni
14.682
+2.608
21.6%
1 gen 2014 anni
15.061
+0.378
2.58%
1 gen 2015 anni
15.14
+0.079
0.52%
Classificazione dei paesi secondo i statistiche attuali per anni