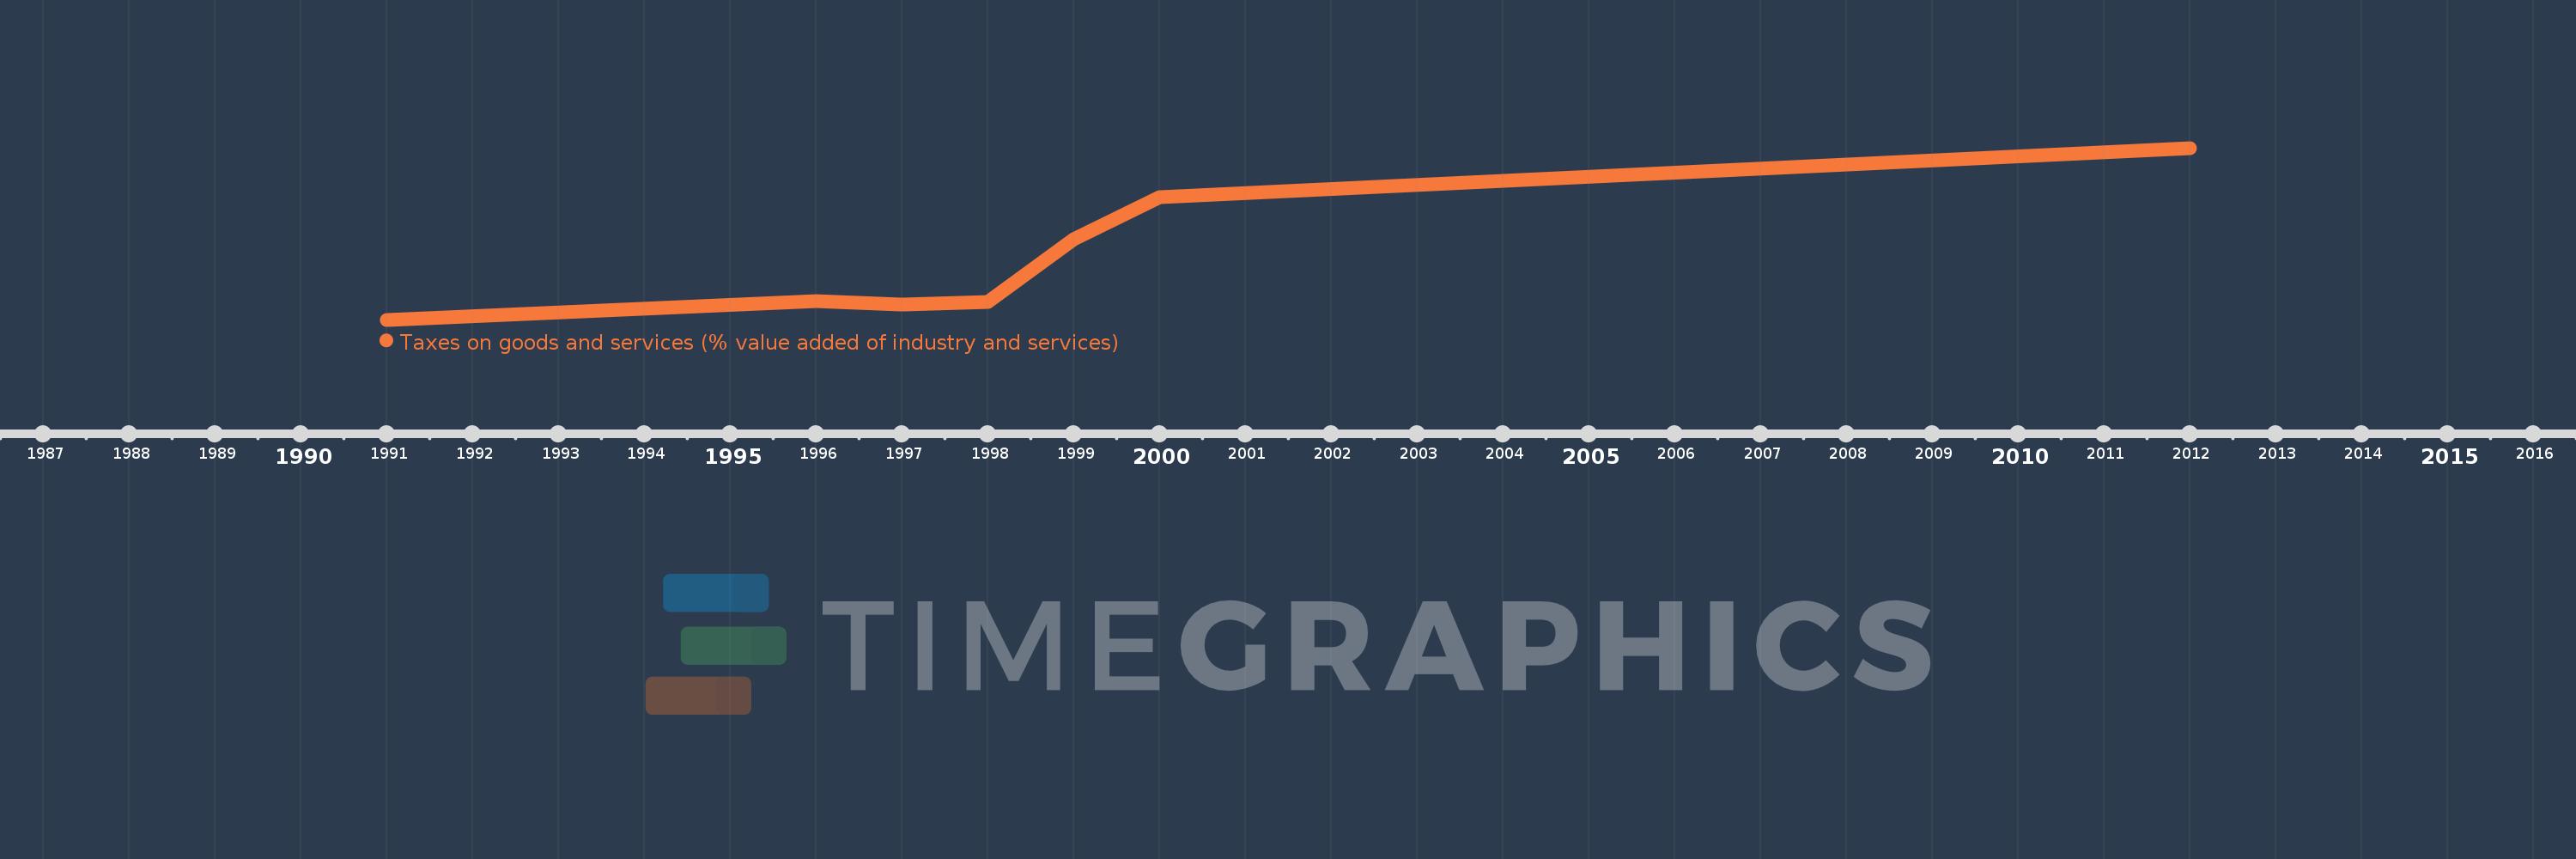
Questa scala temporale mostra un grafico dal 1991 anno al 2012 anno. Vanuatu. I dati fino ad 1990 anno non disponibili. Il numero di osservazioni attuali secondo i date: 7.
La fonte (nome):
Indicatori dello sviluppo mondiale
La fonte (organizzazione):
International Monetary Fund, Government Finance Statistics Yearbook and data files, and World Bank and OECD value added estimates.
Categorie:
Public Sector
sono stati aggiornati
23 apr 2017 anni
Indicatori delle variazioni dei valori per anni
In media:
12.068
Minima:
8.54
1 gen 1991 anni
Massimo:
18.484
1 gen 2012 anni
Alla data di osservazione
Valore
Variazione assoluta
La variazione rispetto al valore precedente
1 gen 1991 anni
8.54
+8.54
0.0%
1 gen 1996 anni
9.639
+1.099
12.87%
1 gen 1997 anni
9.415
-0.224
-2.32%
1 gen 1998 anni
9.569
+0.153
1.63%
1 gen 1999 anni
13.179
+3.61
37.73%
1 gen 2000 anni
15.652
+2.473
18.77%
1 gen 2012 anni
18.484
+2.833
18.1%
Classificazione dei paesi secondo i statistiche attuali per anni