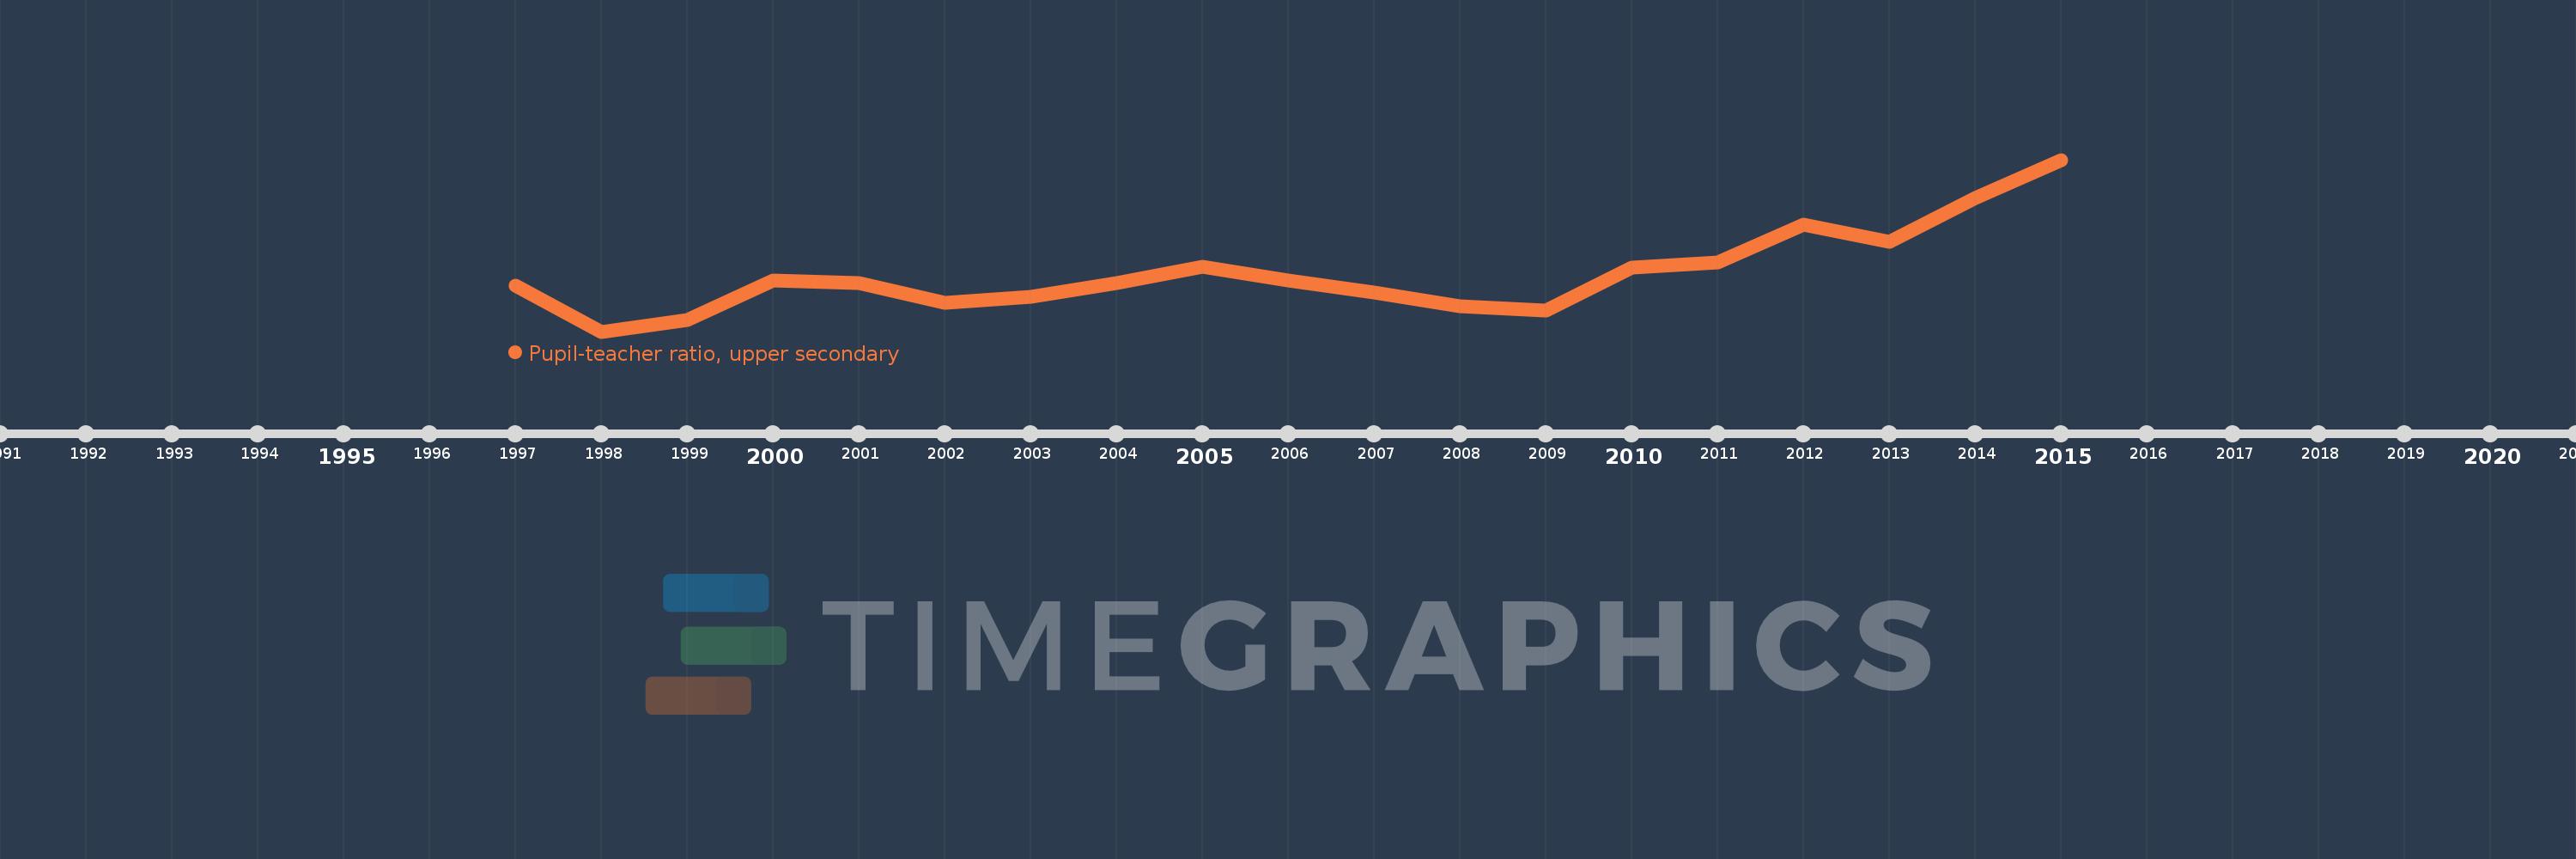
Questa scala temporale mostra un grafico dal 1997 anno al 2015 anno. Bulgaria. I dati fino ad 1996 anno non disponibili. Il numero di osservazioni attuali secondo i date: 19.
La fonte (nome):
Indicatori dello sviluppo mondiale
La fonte (organizzazione):
United Nations Educational, Scientific, and Cultural Organization (UNESCO) Institute for Statistics.
Categorie:
Education
sono stati aggiornati
23 apr 2017 anni
Indicatori delle variazioni dei valori per anni
In media:
11.725
Minima:
11.037
1 gen 1998 anni
Massimo:
13.069
1 gen 2015 anni
Alla data di osservazione
Valore
Variazione assoluta
La variazione rispetto al valore precedente
1 gen 1997 anni
11.578
+11.578
0.0%
1 gen 1998 anni
11.037
-0.541
-4.67%
1 gen 1999 anni
11.174
+0.137
1.24%
1 gen 2000 anni
11.646
+0.473
4.23%
1 gen 2001 anni
11.616
-0.03
-0.26%
1 gen 2002 anni
11.374
-0.242
-2.08%
1 gen 2003 anni
11.444
+0.07
0.61%
1 gen 2004 anni
11.608
+0.163
1.43%
1 gen 2005 anni
11.806
+0.199
1.71%
1 gen 2006 anni
11.643
-0.163
-1.38%
1 gen 2007 anni
11.495
-0.148
-1.27%
1 gen 2008 anni
11.334
-0.161
-1.4%
1 gen 2009 anni
11.284
-0.05
-0.44%
1 gen 2010 anni
11.794
+0.51
4.52%
1 gen 2011 anni
11.853
+0.059
0.5%
1 gen 2012 anni
12.304
+0.451
3.81%
1 gen 2013 anni
12.099
-0.205
-1.67%
1 gen 2014 anni
12.619
+0.521
4.3%
1 gen 2015 anni
13.069
+0.45
3.56%
Classificazione dei paesi secondo i statistiche attuali per anni