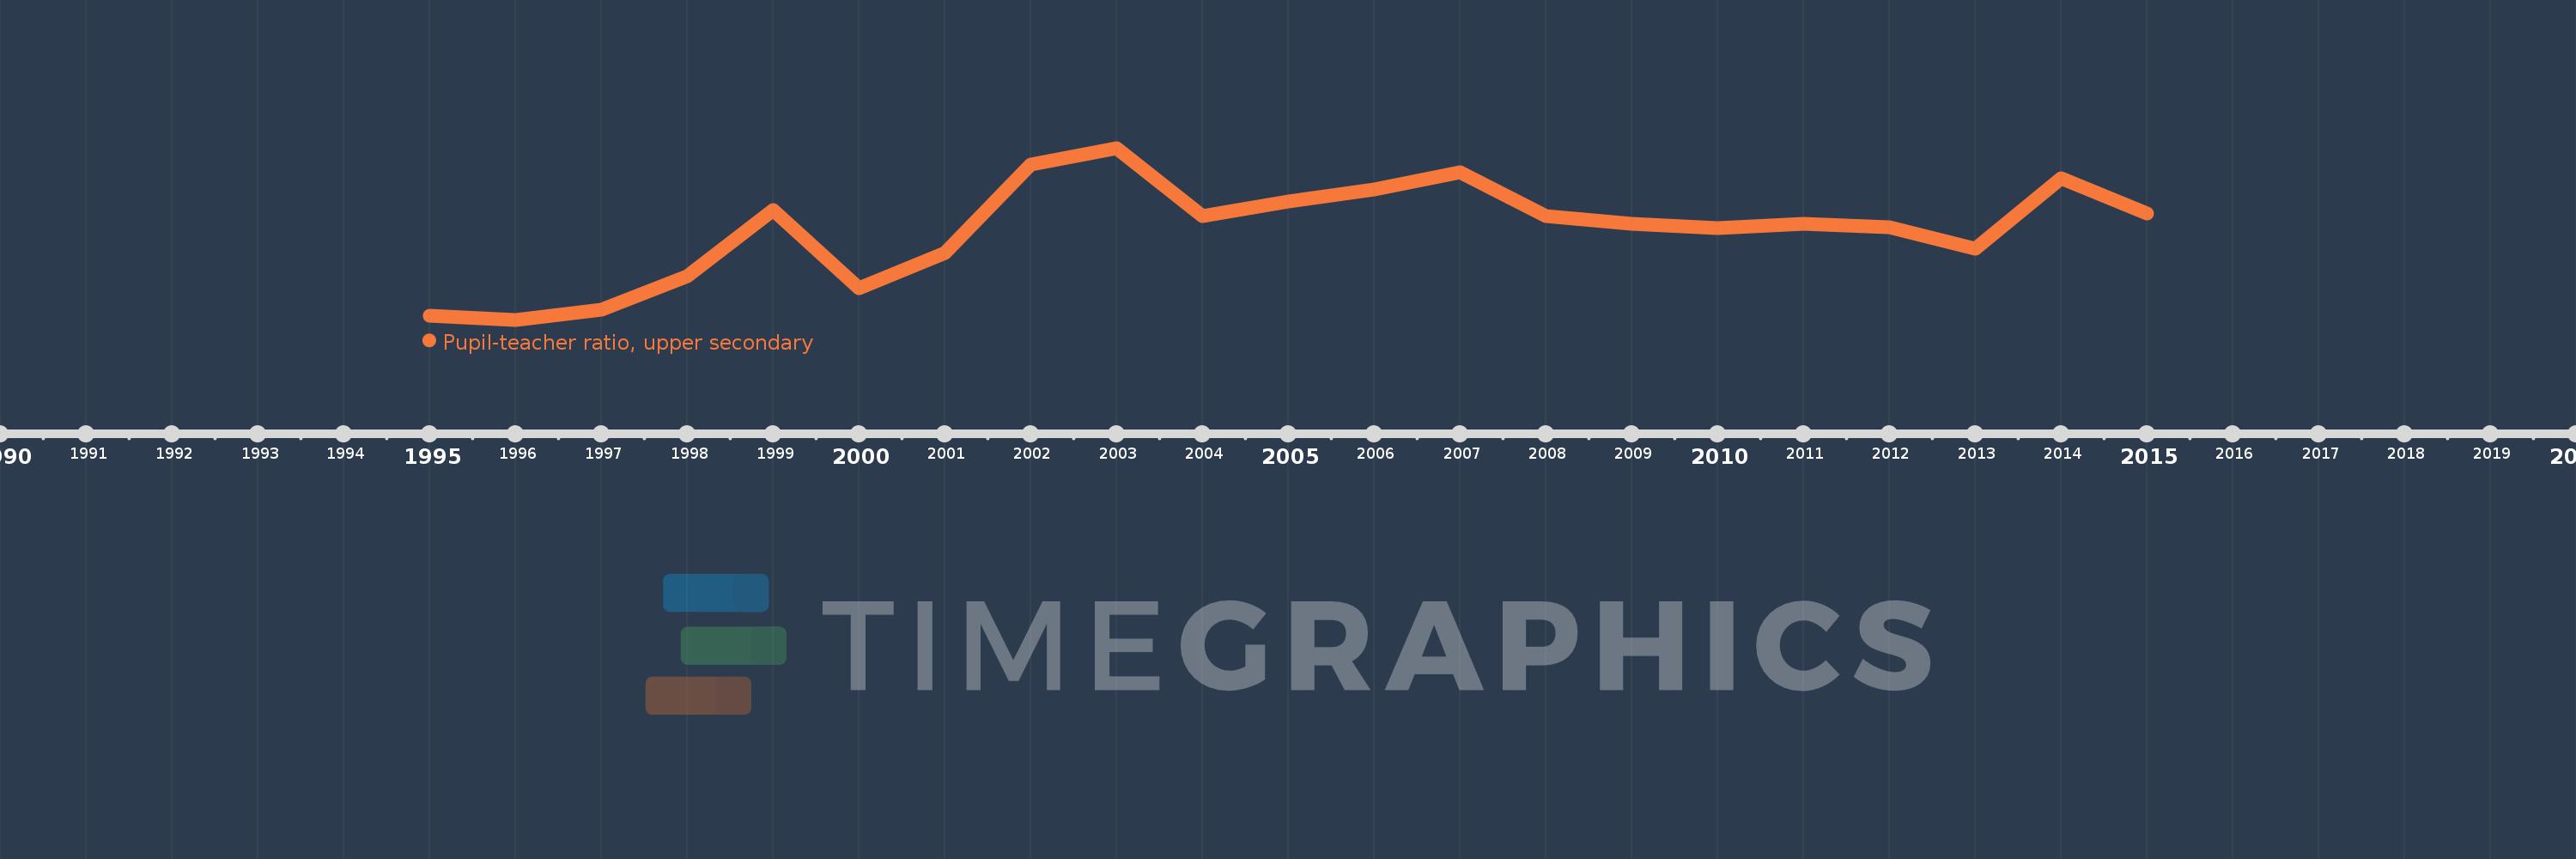
Questa scala temporale mostra un grafico dal 1995 anno al 2015 anno. Late-demographic dividend. I dati fino ad 1994 anno non disponibili. Il numero di osservazioni attuali secondo i date: 21.
La fonte (nome):
Indicatori dello sviluppo mondiale
La fonte (organizzazione):
United Nations Educational, Scientific, and Cultural Organization (UNESCO) Institute for Statistics.
Categorie:
Education
sono stati aggiornati
23 apr 2017 anni
Indicatori delle variazioni dei valori per anni
In media:
15.276
Minima:
13.484
1 gen 1996 anni
Massimo:
16.905
1 gen 2003 anni
Alla data di osservazione
Valore
Variazione assoluta
La variazione rispetto al valore precedente
1 gen 1995 anni
13.557
+13.557
0.0%
1 gen 1996 anni
13.484
-0.073
-0.54%
1 gen 1997 anni
13.683
+0.199
1.48%
1 gen 1998 anni
14.348
+0.665
4.86%
1 gen 1999 anni
15.666
+1.318
9.18%
1 gen 2000 anni
14.114
-1.552
-9.91%
1 gen 2001 anni
14.806
+0.692
4.91%
1 gen 2002 anni
16.58
+1.773
11.98%
1 gen 2003 anni
16.905
+0.325
1.96%
1 gen 2004 anni
15.544
-1.361
-8.05%
1 gen 2005 anni
15.838
+0.294
1.89%
1 gen 2006 anni
16.073
+0.235
1.48%
1 gen 2007 anni
16.428
+0.355
2.21%
1 gen 2008 anni
15.543
-0.884
-5.38%
1 gen 2009 anni
15.403
-0.14
-0.9%
1 gen 2010 anni
15.303
-0.101
-0.65%
1 gen 2011 anni
15.394
+0.091
0.6%
1 gen 2012 anni
15.325
-0.069
-0.45%
1 gen 2013 anni
14.897
-0.428
-2.8%
1 gen 2014 anni
16.301
+1.404
9.42%
1 gen 2015 anni
15.596
-0.705
-4.32%
Classificazione dei paesi secondo i statistiche attuali per anni