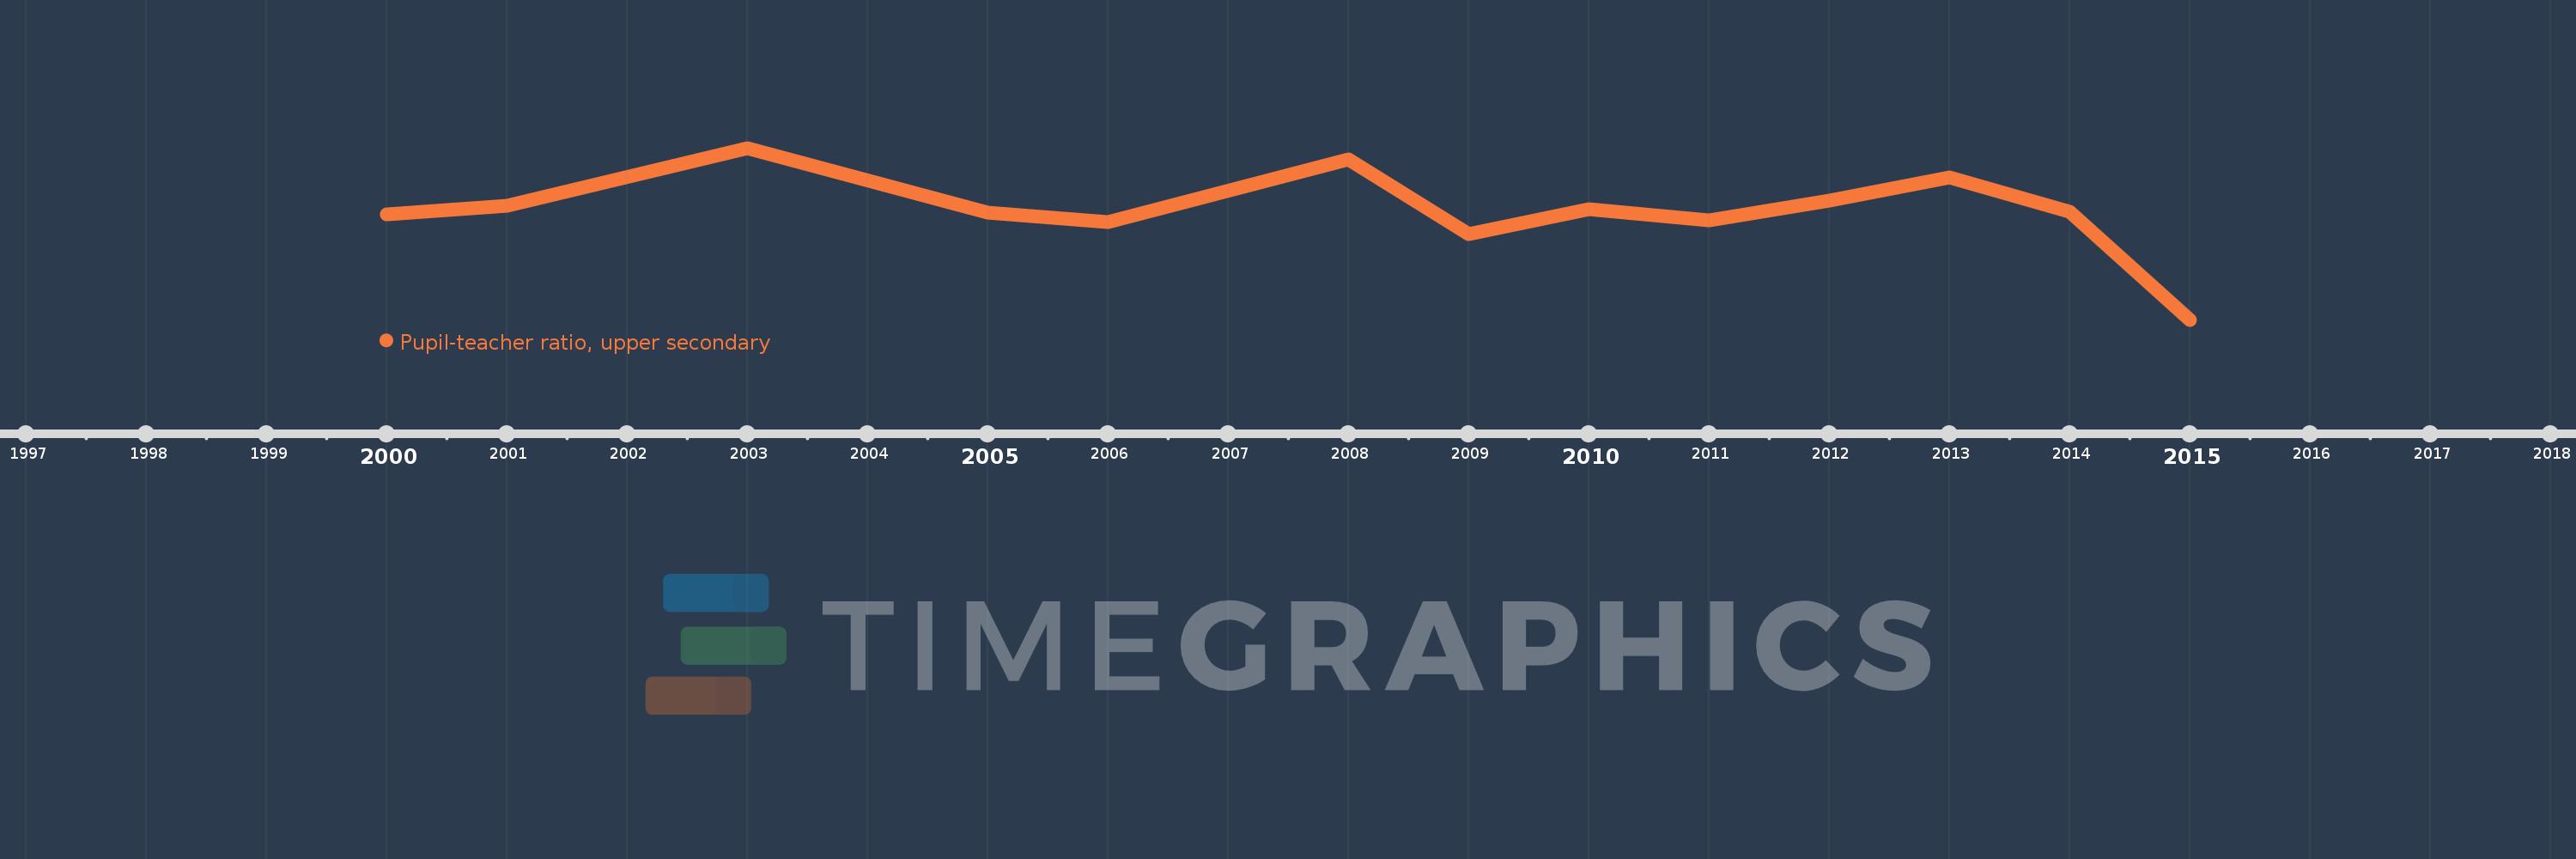
Questa scala temporale mostra un grafico dal 2000 anno al 2015 anno. Dominican Republic. I dati fino ad 1999 anno non disponibili. Il numero di osservazioni attuali secondo i date: 13.
La fonte (nome):
Indicatori dello sviluppo mondiale
La fonte (organizzazione):
United Nations Educational, Scientific, and Cultural Organization (UNESCO) Institute for Statistics.
Categorie:
Education
sono stati aggiornati
23 apr 2017 anni
Indicatori delle variazioni dei valori per anni
In media:
27.937
Minima:
19.851
1 gen 2015 anni
Massimo:
32.551
1 gen 2003 anni
Alla data di osservazione
Valore
Variazione assoluta
La variazione rispetto al valore precedente
1 gen 2000 anni
27.65
+27.65
0.0%
1 gen 2001 anni
28.259
+0.609
2.2%
1 gen 2003 anni
32.551
+4.292
15.19%
1 gen 2005 anni
27.789
-4.762
-14.63%
1 gen 2006 anni
27.054
-0.735
-2.64%
1 gen 2008 anni
31.719
+4.665
17.24%
1 gen 2009 anni
26.198
-5.521
-17.41%
1 gen 2010 anni
28.001
+1.803
6.88%
1 gen 2011 anni
27.199
-0.802
-2.86%
1 gen 2012 anni
28.671
+1.471
5.41%
1 gen 2013 anni
30.392
+1.722
6.0%
1 gen 2014 anni
27.841
-2.552
-8.4%
1 gen 2015 anni
19.851
-7.989
-28.7%
Classificazione dei paesi secondo i statistiche attuali per anni