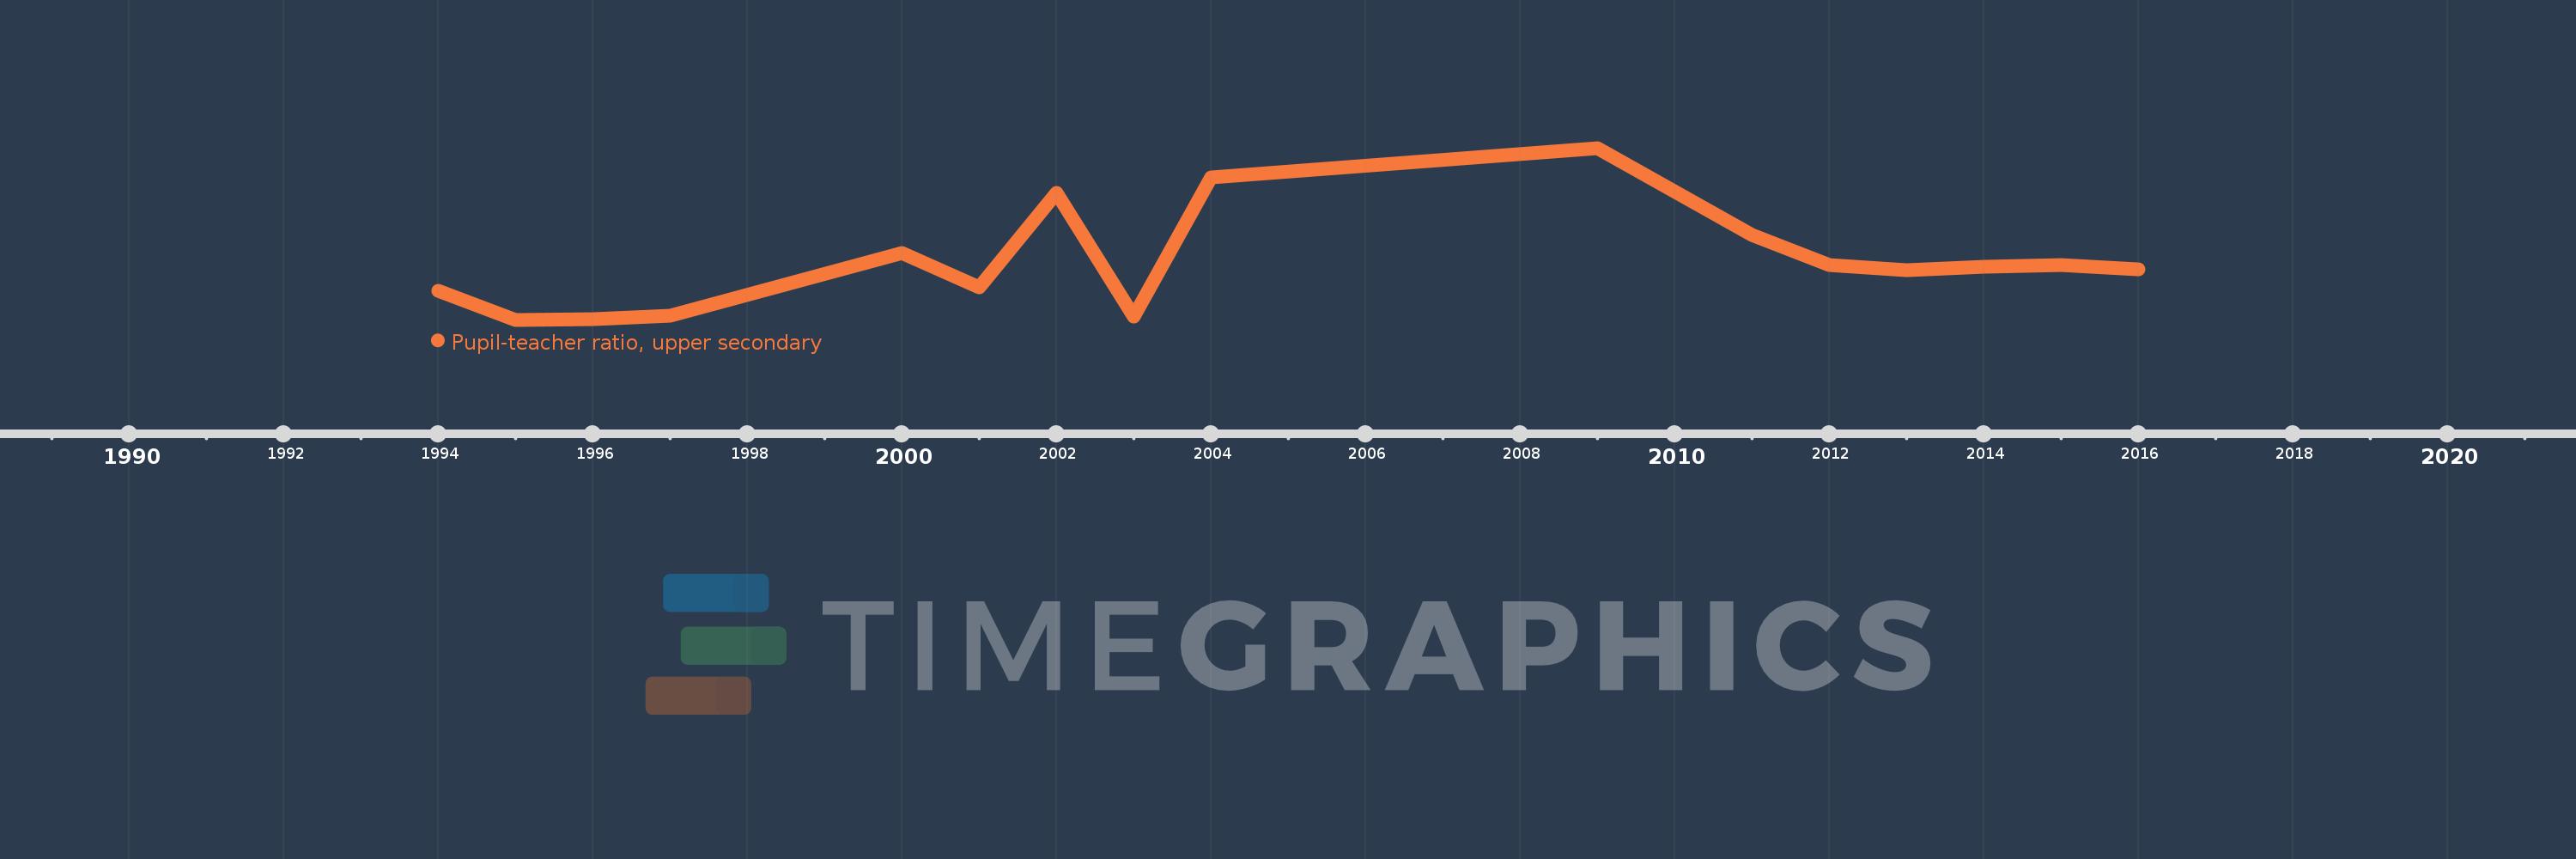
Questa scala temporale mostra un grafico dal 1994 anno al 2016 anno. Nepal. I dati fino ad 1993 anno non disponibili. Il numero di osservazioni attuali secondo i date: 16.
La fonte (nome):
Indicatori dello sviluppo mondiale
La fonte (organizzazione):
United Nations Educational, Scientific, and Cultural Organization (UNESCO) Institute for Statistics.
Categorie:
Education
sono stati aggiornati
23 apr 2017 anni
Indicatori delle variazioni dei valori per anni
In media:
23.202
Minima:
19.85
1 gen 1995 anni
Massimo:
29.819
1 gen 2009 anni
Alla data di osservazione
Valore
Variazione assoluta
La variazione rispetto al valore precedente
1 gen 1994 anni
21.551
+21.551
0.0%
1 gen 1995 anni
19.85
-1.701
-7.89%
1 gen 1996 anni
19.893
+0.043
0.22%
1 gen 1997 anni
20.084
+0.19
0.96%
1 gen 2000 anni
23.726
+3.642
18.13%
1 gen 2001 anni
21.711
-2.015
-8.49%
1 gen 2002 anni
27.206
+5.495
25.31%
1 gen 2003 anni
20.048
-7.158
-26.31%
1 gen 2004 anni
28.109
+8.061
40.21%
1 gen 2009 anni
29.819
+1.71
6.08%
1 gen 2011 anni
24.764
-5.055
-16.95%
1 gen 2012 anni
23.039
-1.725
-6.96%
1 gen 2013 anni
22.722
-0.317
-1.38%
1 gen 2014 anni
22.907
+0.185
0.81%
1 gen 2015 anni
23.007
+0.1
0.44%
1 gen 2016 anni
22.797
-0.21
-0.91%
Classificazione dei paesi secondo i statistiche attuali per anni