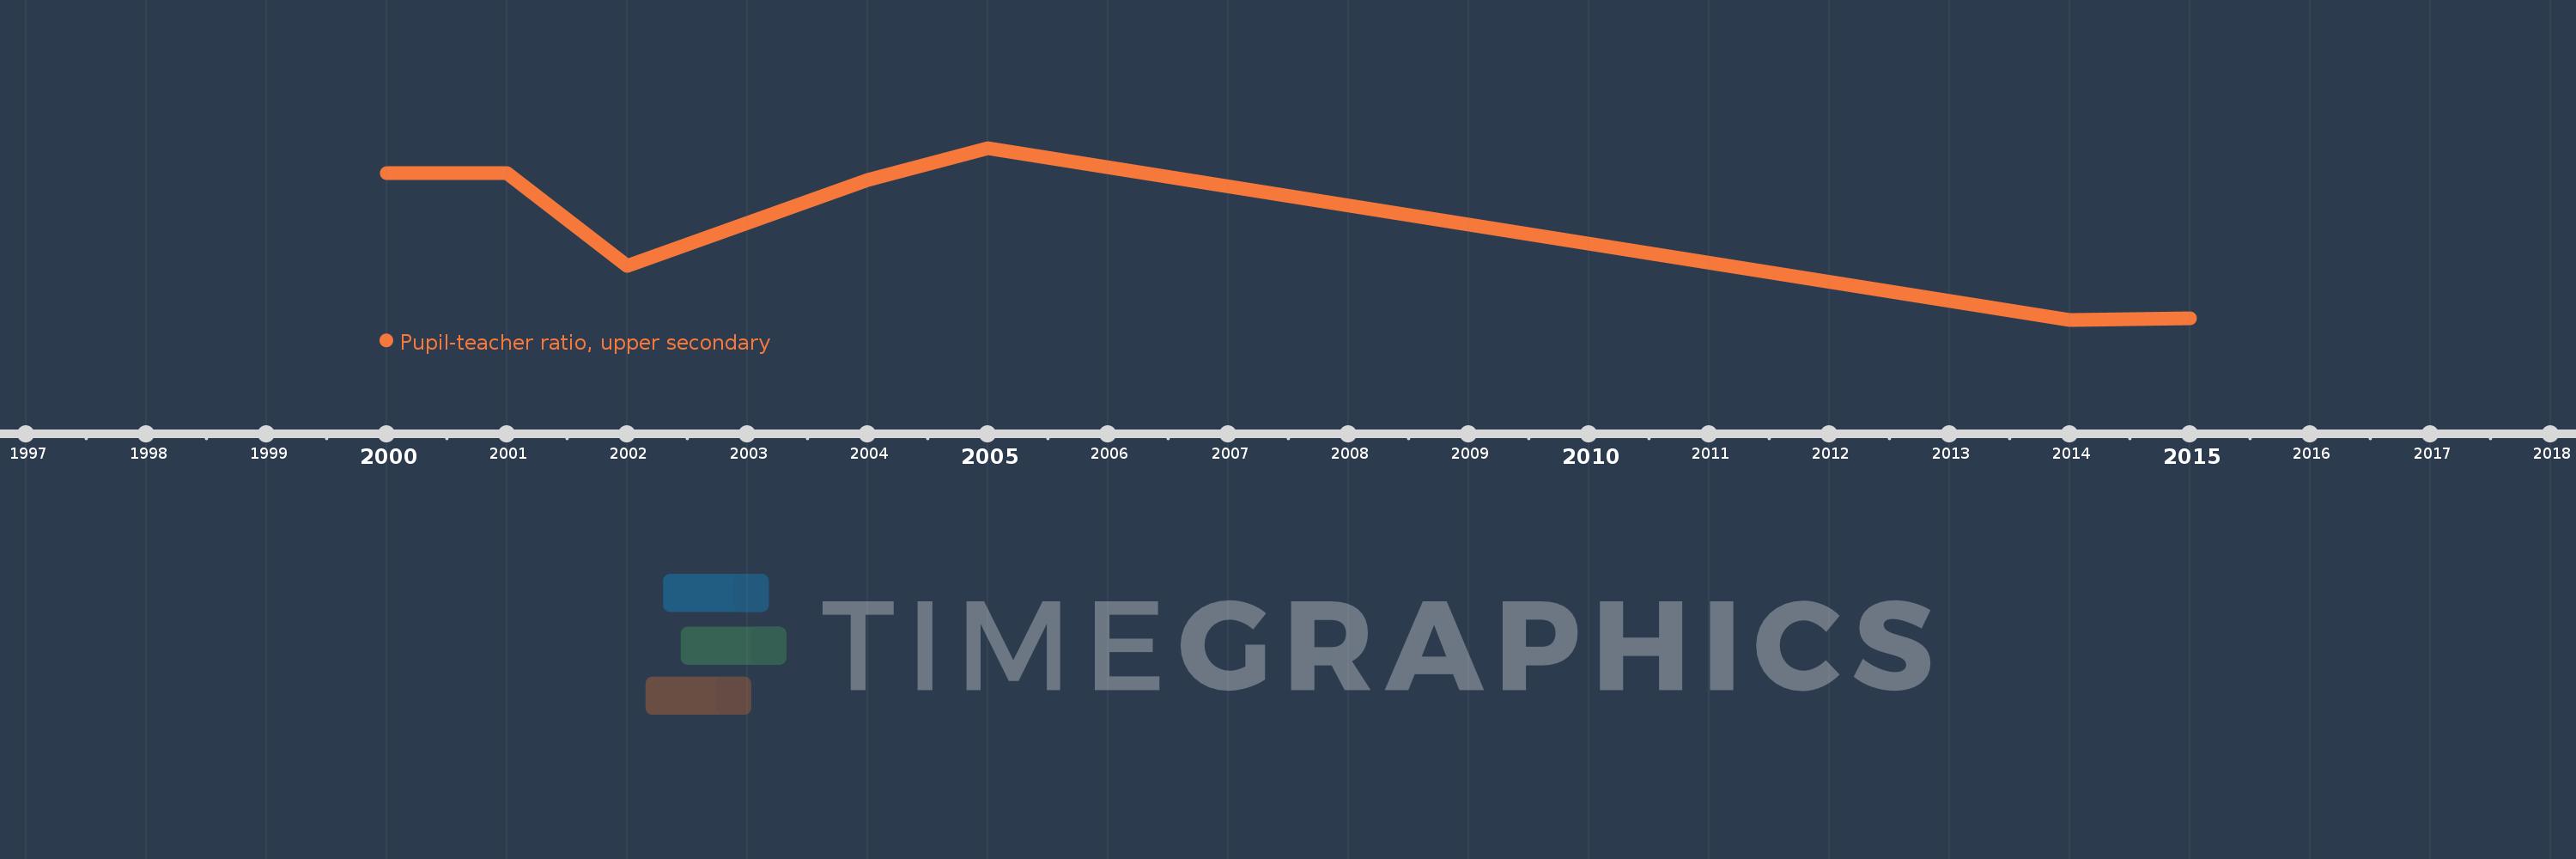
Questa scala temporale mostra un grafico dal 2000 anno al 2015 anno. Benin. I dati fino ad 1999 anno non disponibili. Il numero di osservazioni attuali secondo i date: 7.
La fonte (nome):
Indicatori dello sviluppo mondiale
La fonte (organizzazione):
United Nations Educational, Scientific, and Cultural Organization (UNESCO) Institute for Statistics.
Categorie:
Education
sono stati aggiornati
23 apr 2017 anni
Indicatori delle variazioni dei valori per anni
In media:
12.483
Minima:
7.629
1 gen 2014 anni
Massimo:
16.478
1 gen 2005 anni
Alla data di osservazione
Valore
Variazione assoluta
La variazione rispetto al valore precedente
1 gen 2000 anni
15.169
+15.169
0.0%
1 gen 2001 anni
15.172
+0.003
0.02%
1 gen 2002 anni
10.418
-4.754
-31.33%
1 gen 2004 anni
14.816
+4.398
42.21%
1 gen 2005 anni
16.478
+1.662
11.22%
1 gen 2014 anni
7.629
-8.849
-53.7%
1 gen 2015 anni
7.698
+0.069
0.91%
Classificazione dei paesi secondo i statistiche attuali per anni