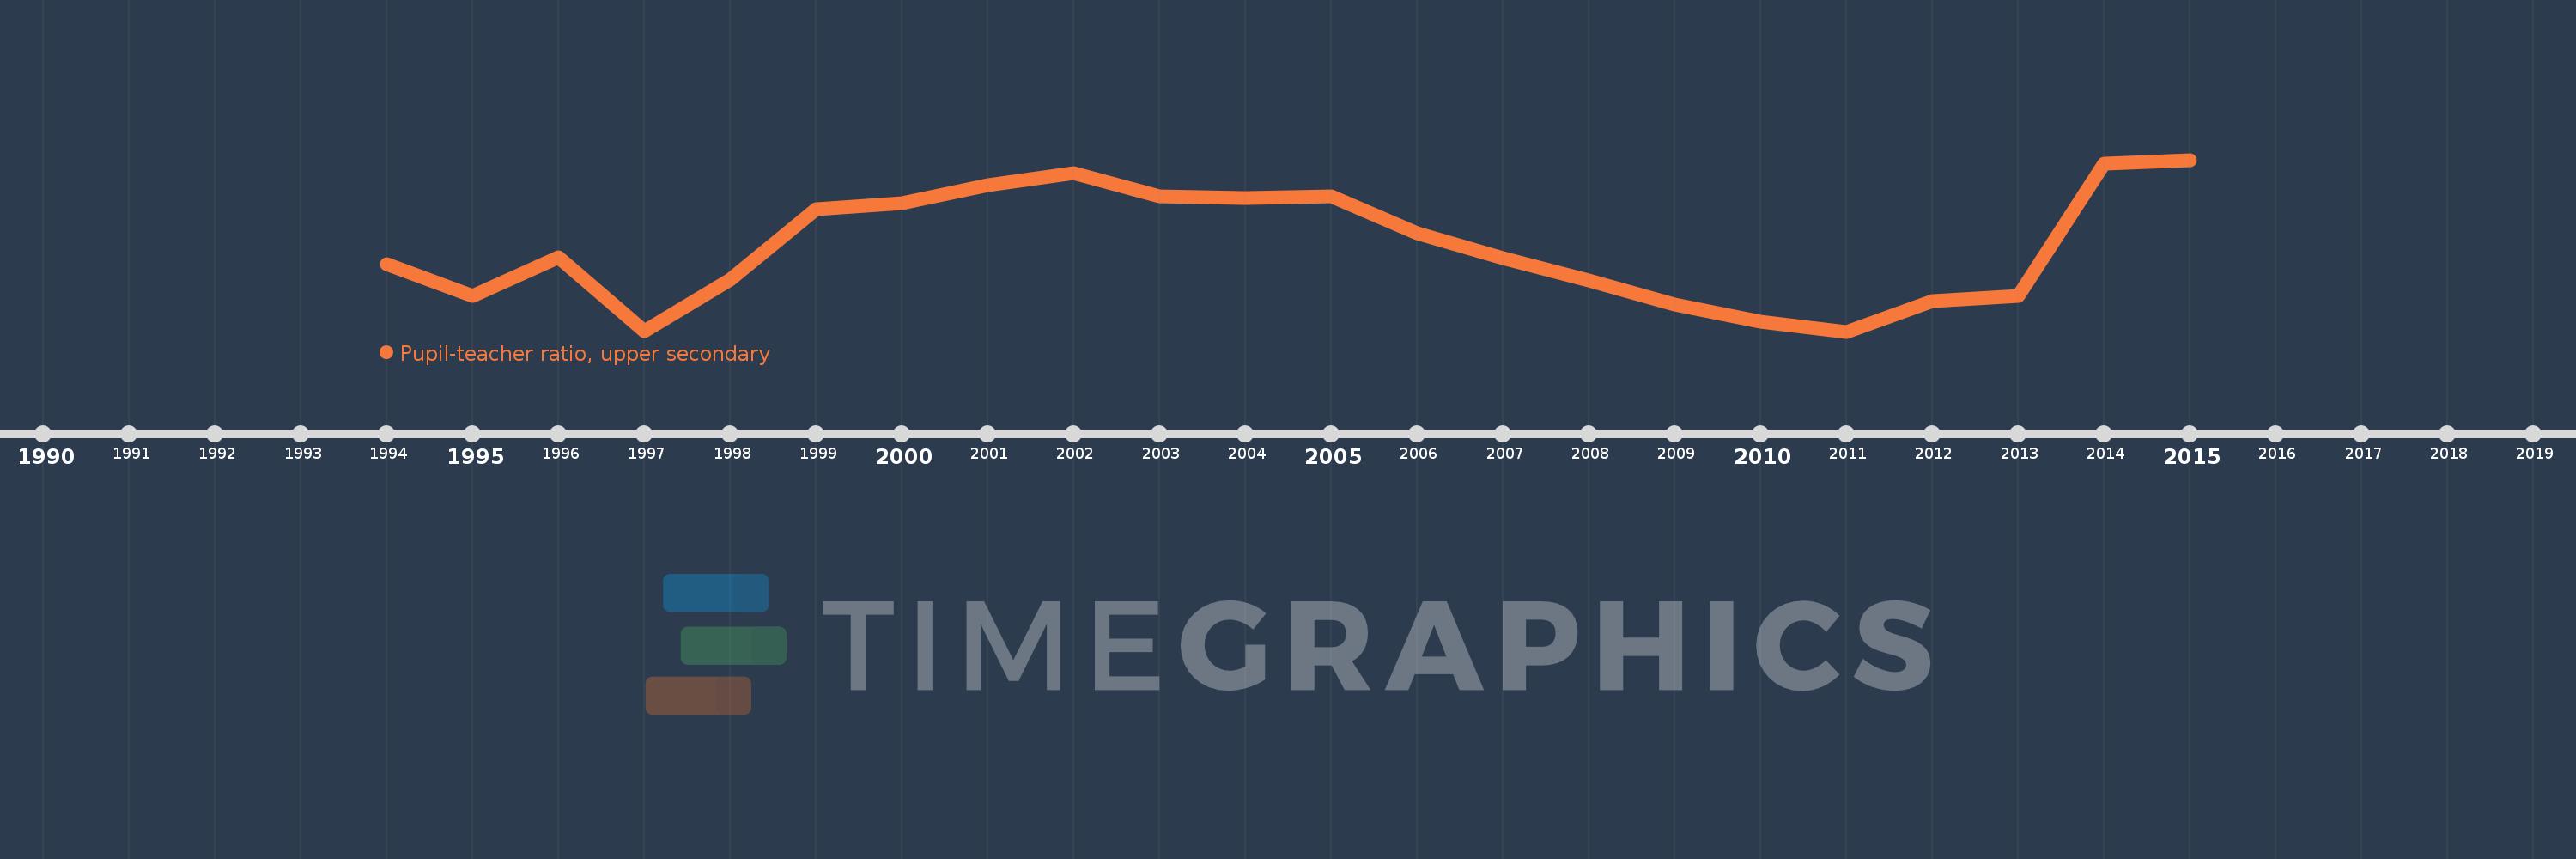
Questa scala temporale mostra un grafico dal 1994 anno al 2015 anno. Early-demographic dividend. I dati fino ad 1993 anno non disponibili. Il numero di osservazioni attuali secondo i date: 22.
La fonte (nome):
Indicatori dello sviluppo mondiale
La fonte (organizzazione):
United Nations Educational, Scientific, and Cultural Organization (UNESCO) Institute for Statistics.
Categorie:
Education
sono stati aggiornati
23 apr 2017 anni
Indicatori delle variazioni dei valori per anni
In media:
19.778
Minima:
17.684
1 gen 2011 anni
Massimo:
21.948
1 gen 2015 anni
Alla data di osservazione
Valore
Variazione assoluta
La variazione rispetto al valore precedente
1 gen 1994 anni
19.352
+19.352
0.0%
1 gen 1995 anni
18.579
-0.773
-3.99%
1 gen 1996 anni
19.537
+0.958
5.15%
1 gen 1997 anni
17.695
-1.842
-9.43%
1 gen 1998 anni
18.965
+1.27
7.18%
1 gen 1999 anni
20.716
+1.751
9.23%
1 gen 2000 anni
20.873
+0.157
0.76%
1 gen 2001 anni
21.327
+0.454
2.17%
1 gen 2002 anni
21.608
+0.281
1.32%
1 gen 2003 anni
21.052
-0.556
-2.57%
1 gen 2004 anni
21.002
-0.05
-0.24%
1 gen 2005 anni
21.046
+0.044
0.21%
1 gen 2006 anni
20.126
-0.921
-4.37%
1 gen 2007 anni
19.513
-0.613
-3.04%
1 gen 2008 anni
18.95
-0.563
-2.88%
1 gen 2009 anni
18.364
-0.586
-3.09%
1 gen 2010 anni
17.919
-0.445
-2.42%
1 gen 2011 anni
17.684
-0.235
-1.31%
1 gen 2012 anni
18.434
+0.75
4.24%
1 gen 2013 anni
18.56
+0.126
0.69%
1 gen 2014 anni
21.859
+3.299
17.77%
1 gen 2015 anni
21.948
+0.089
0.41%
Classificazione dei paesi secondo i statistiche attuali per anni