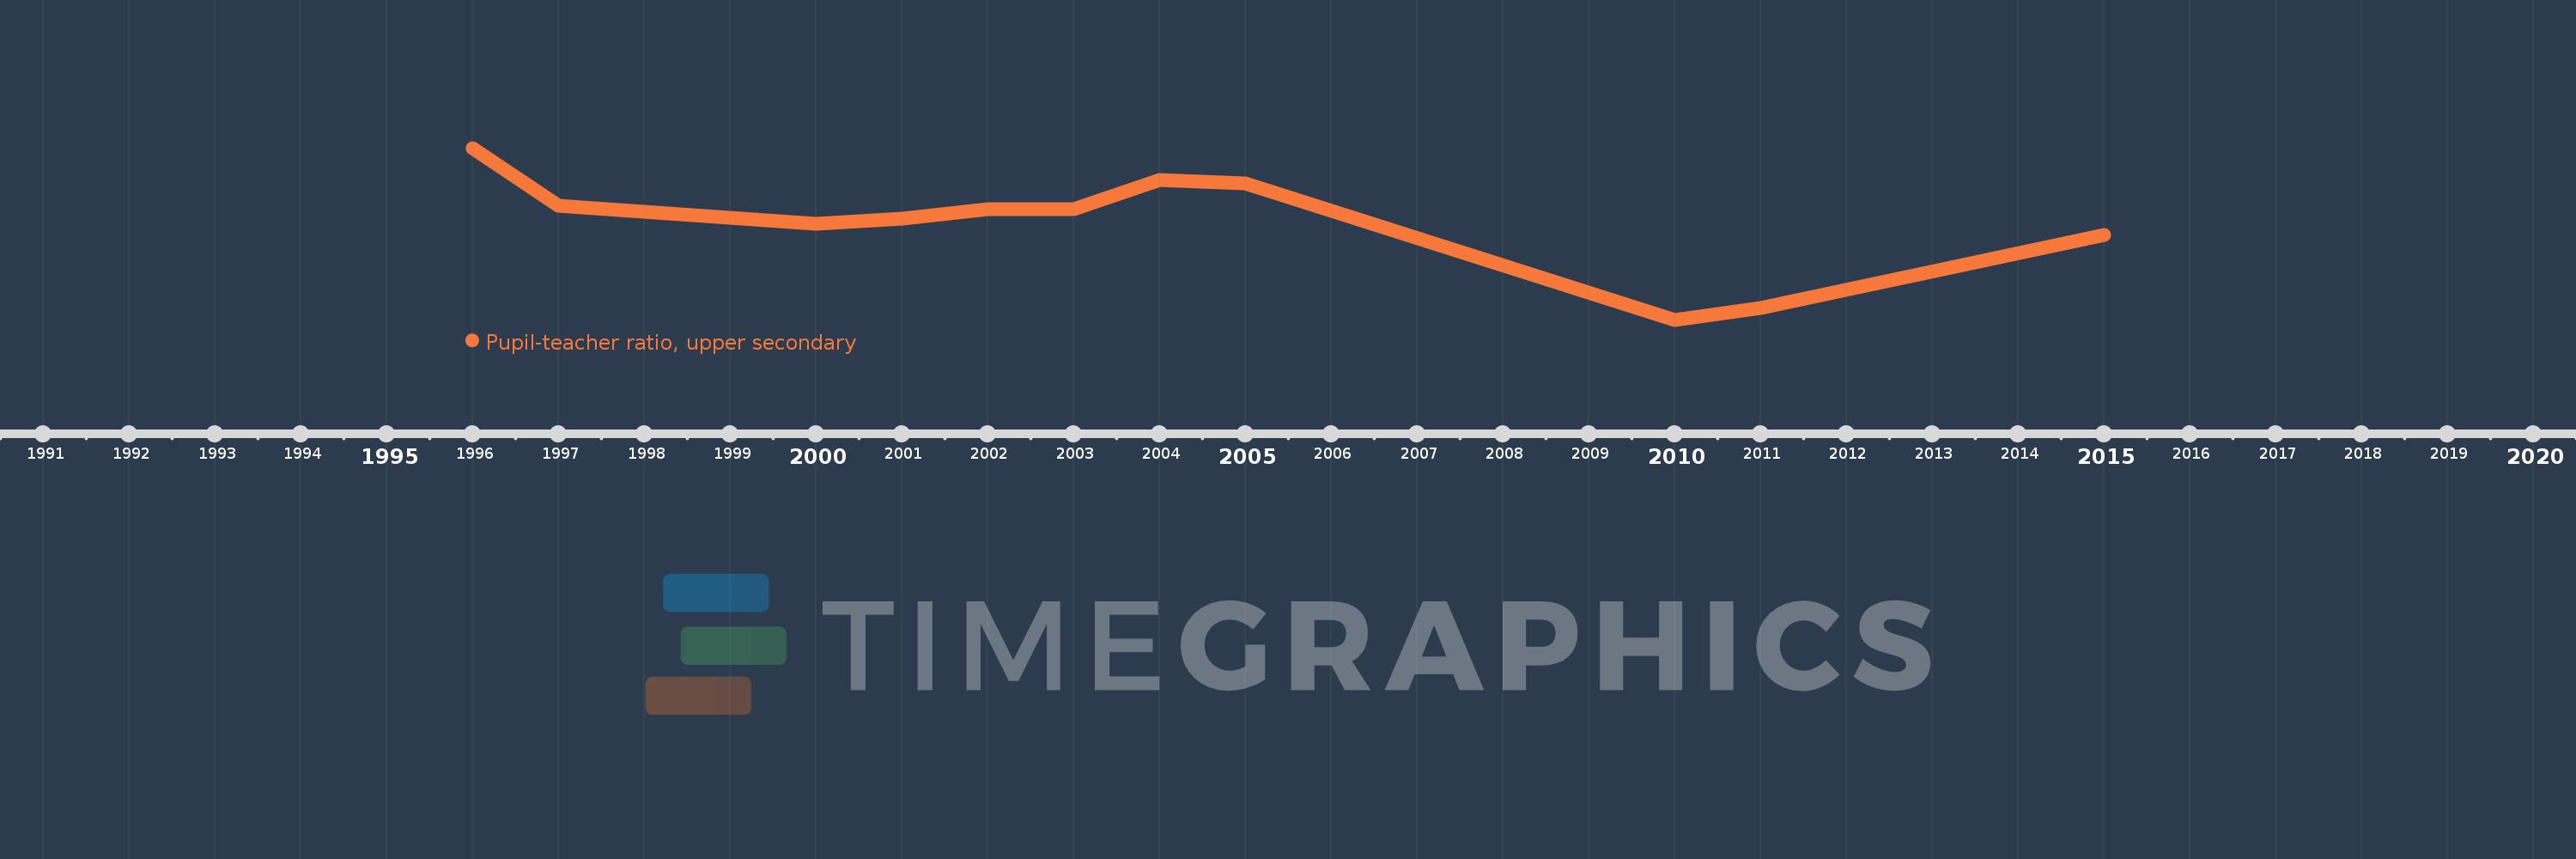
Questa scala temporale mostra un grafico dal 1996 anno al 2015 anno. Egypt, Arab Rep.. I dati fino ad 1995 anno non disponibili. Il numero di osservazioni attuali secondo i date: 11.
La fonte (nome):
Indicatori dello sviluppo mondiale
La fonte (organizzazione):
United Nations Educational, Scientific, and Cultural Organization (UNESCO) Institute for Statistics.
Categorie:
Education
sono stati aggiornati
23 apr 2017 anni
Indicatori delle variazioni dei valori per anni
In media:
12.666
Minima:
8.299
1 gen 2010 anni
Massimo:
15.969
1 gen 1996 anni
Alla data di osservazione
Valore
Variazione assoluta
La variazione rispetto al valore precedente
1 gen 1996 anni
15.969
+15.969
0.0%
1 gen 1997 anni
13.395
-2.574
-16.12%
1 gen 2000 anni
12.579
-0.816
-6.09%
1 gen 2001 anni
12.799
+0.22
1.75%
1 gen 2002 anni
13.233
+0.434
3.39%
1 gen 2003 anni
13.224
-0.009
-0.07%
1 gen 2004 anni
14.539
+1.315
9.94%
1 gen 2005 anni
14.383
-0.157
-1.08%
1 gen 2010 anni
8.299
-6.084
-42.3%
1 gen 2011 anni
8.822
+0.523
6.3%
1 gen 2015 anni
12.087
+3.265
37.02%
Classificazione dei paesi secondo i statistiche attuali per anni