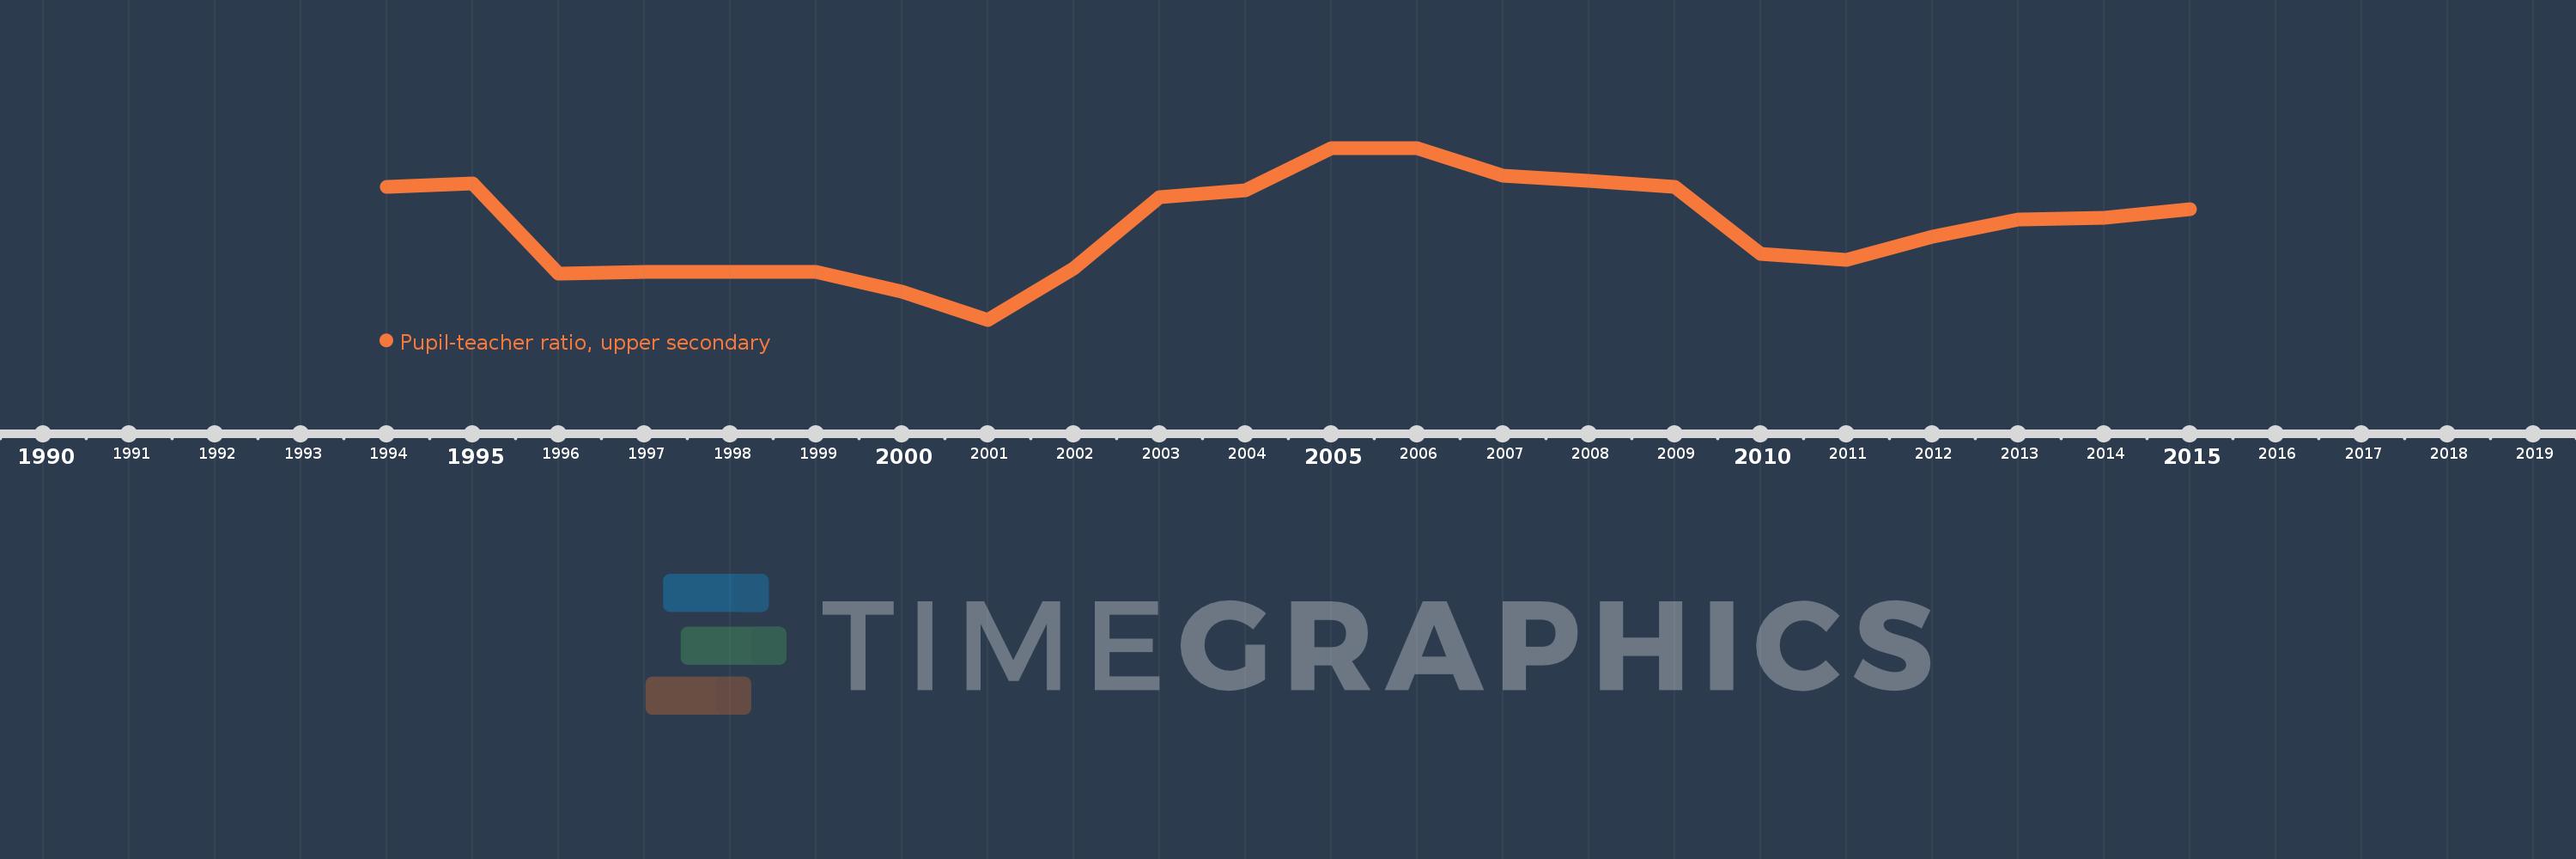
Questa scala temporale mostra un grafico dal 1994 anno al 2015 anno. United States. I dati fino ad 1993 anno non disponibili. Il numero di osservazioni attuali secondo i date: 21.
La fonte (nome):
Indicatori dello sviluppo mondiale
La fonte (organizzazione):
United Nations Educational, Scientific, and Cultural Organization (UNESCO) Institute for Statistics.
Categorie:
Education
sono stati aggiornati
23 apr 2017 anni
Indicatori delle variazioni dei valori per anni
In media:
14.61
Minima:
13.478
1 gen 2001 anni
Massimo:
15.494
1 gen 2006 anni
Alla data di osservazione
Valore
Variazione assoluta
La variazione rispetto al valore precedente
1 gen 1994 anni
15.038
+15.038
0.0%
1 gen 1995 anni
15.079
+0.04
0.27%
1 gen 1996 anni
14.024
-1.055
-6.99%
1 gen 1997 anni
14.039
+0.015
0.11%
1 gen 1999 anni
14.04
+0.001
0.01%
1 gen 2000 anni
13.811
-0.229
-1.63%
1 gen 2001 anni
13.478
-0.333
-2.41%
1 gen 2002 anni
14.076
+0.598
4.44%
1 gen 2003 anni
14.915
+0.839
5.96%
1 gen 2004 anni
15.0
+0.085
0.57%
1 gen 2005 anni
15.493
+0.492
3.28%
1 gen 2006 anni
15.494
+0.001
0.01%
1 gen 2007 anni
15.171
-0.323
-2.09%
1 gen 2008 anni
15.109
-0.061
-0.4%
1 gen 2009 anni
15.036
-0.074
-0.49%
1 gen 2010 anni
14.251
-0.784
-5.22%
1 gen 2011 anni
14.184
-0.067
-0.47%
1 gen 2012 anni
14.456
+0.272
1.92%
1 gen 2013 anni
14.653
+0.197
1.36%
1 gen 2014 anni
14.679
+0.026
0.18%
1 gen 2015 anni
14.774
+0.095
0.65%
Classificazione dei paesi secondo i statistiche attuali per anni