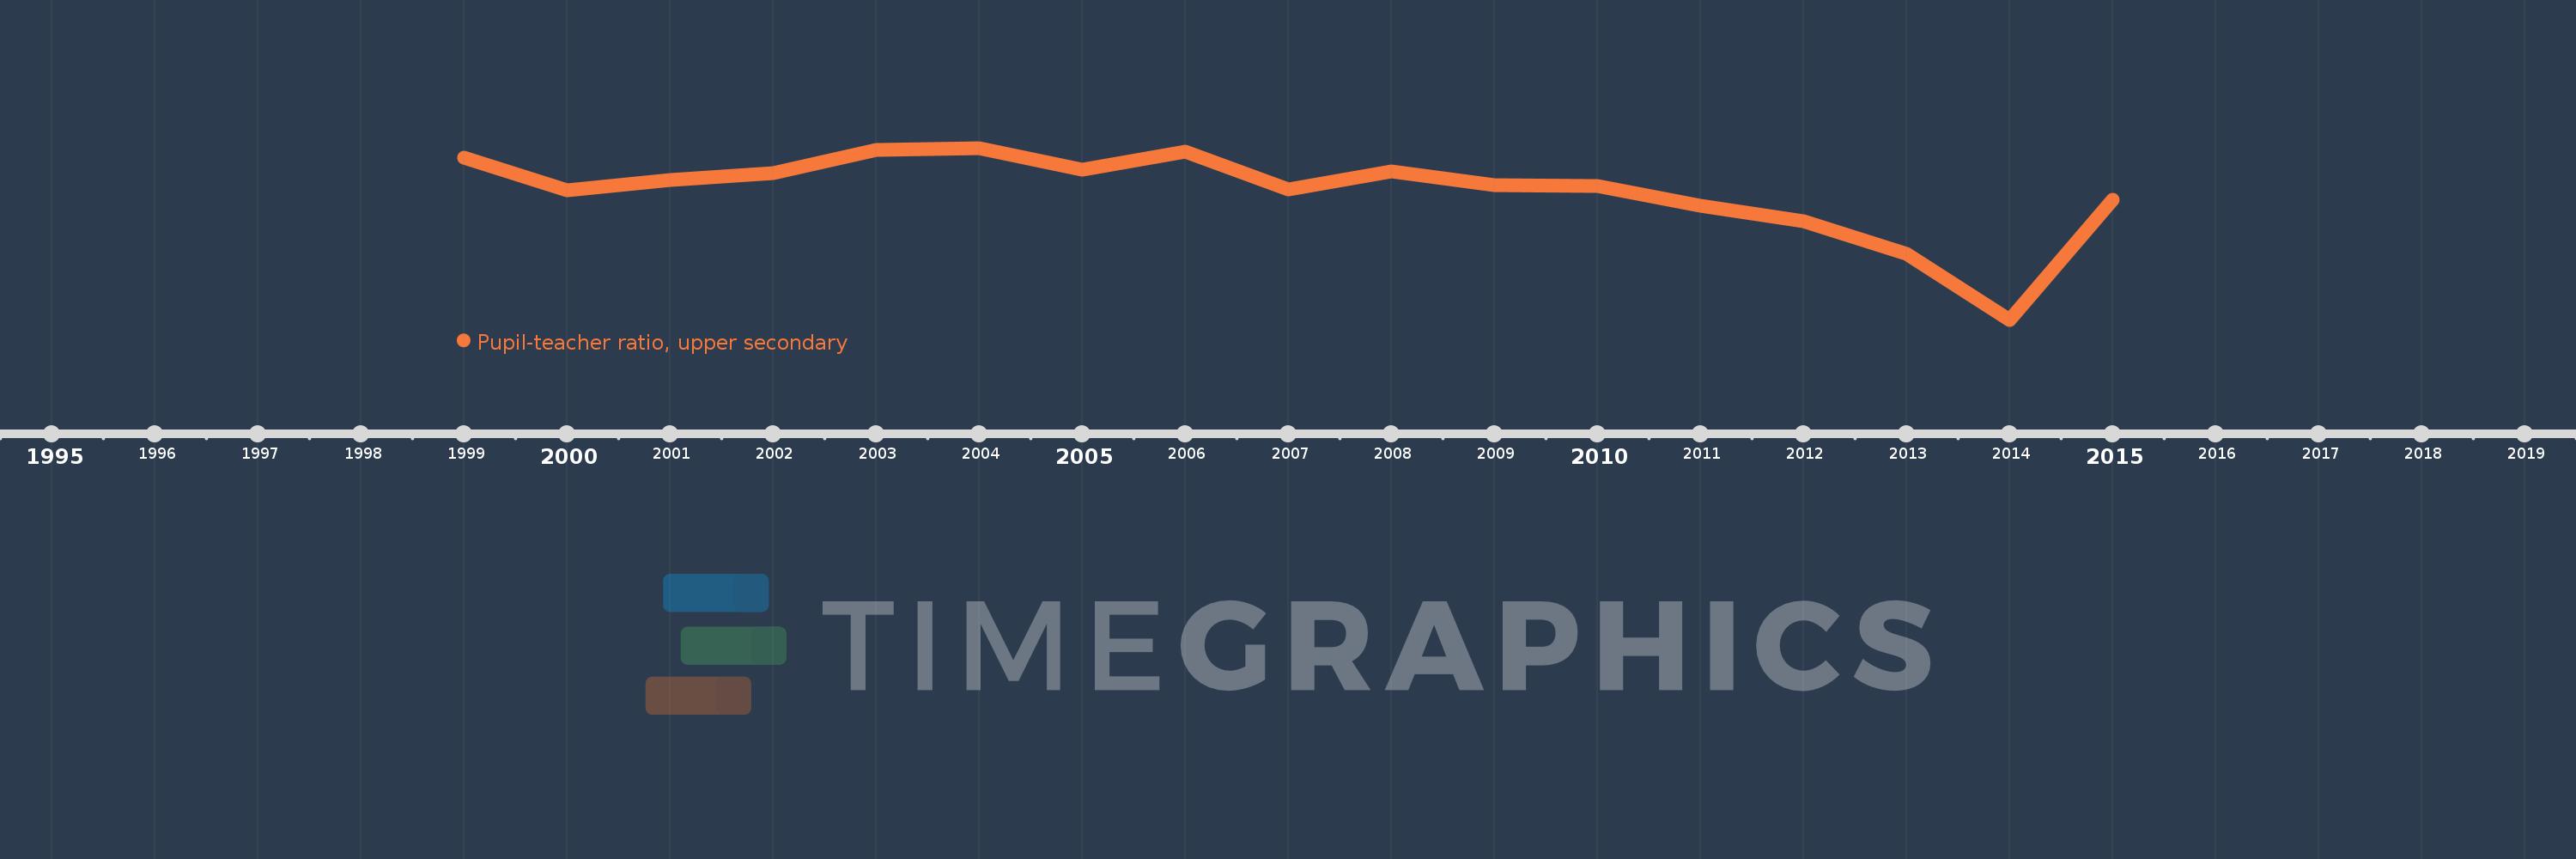
Questa scala temporale mostra un grafico dal 1999 anno al 2015 anno. Other small states. I dati fino ad 1998 anno non disponibili. Il numero di osservazioni attuali secondo i date: 17.
La fonte (nome):
Indicatori dello sviluppo mondiale
La fonte (organizzazione):
United Nations Educational, Scientific, and Cultural Organization (UNESCO) Institute for Statistics.
Categorie:
Education
sono stati aggiornati
23 apr 2017 anni
Indicatori delle variazioni dei valori per anni
In media:
13.179
Minima:
11.93
1 gen 2014 anni
Massimo:
13.599
1 gen 2004 anni
Alla data di osservazione
Valore
Variazione assoluta
La variazione rispetto al valore precedente
1 gen 1999 anni
13.502
+13.502
0.0%
1 gen 2000 anni
13.185
-0.316
-2.34%
1 gen 2001 anni
13.291
+0.106
0.8%
1 gen 2002 anni
13.356
+0.065
0.49%
1 gen 2003 anni
13.583
+0.226
1.7%
1 gen 2004 anni
13.599
+0.017
0.12%
1 gen 2005 anni
13.392
-0.208
-1.53%
1 gen 2006 anni
13.565
+0.174
1.3%
1 gen 2007 anni
13.2
-0.366
-2.7%
1 gen 2008 anni
13.372
+0.173
1.31%
1 gen 2009 anni
13.241
-0.132
-0.98%
1 gen 2010 anni
13.233
-0.007
-0.05%
1 gen 2011 anni
13.04
-0.194
-1.47%
1 gen 2012 anni
12.888
-0.152
-1.16%
1 gen 2013 anni
12.57
-0.318
-2.46%
1 gen 2014 anni
11.93
-0.641
-5.1%
1 gen 2015 anni
13.098
+1.168
9.79%
Classificazione dei paesi secondo i statistiche attuali per anni