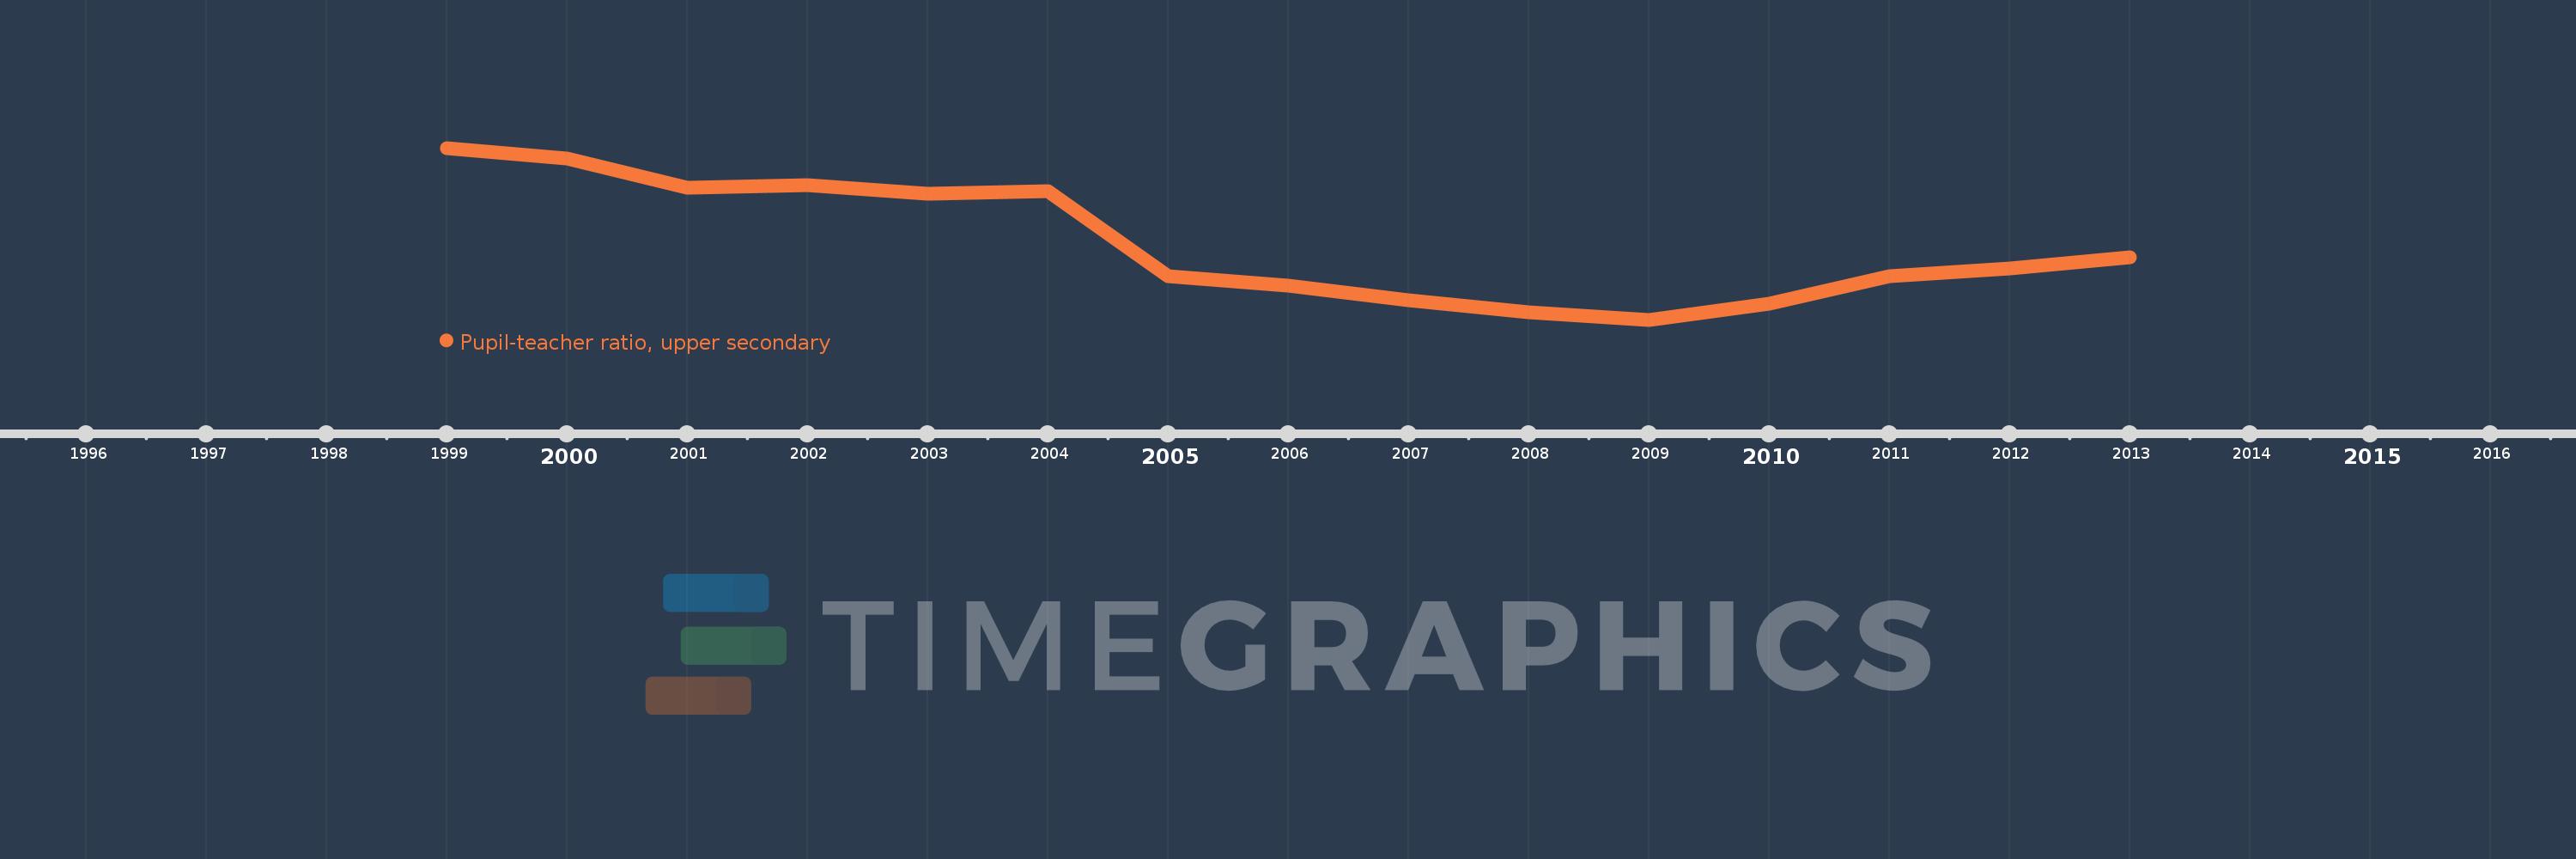
Questa scala temporale mostra un grafico dal 1999 anno al 2013 anno. Iceland. I dati fino ad 1998 anno non disponibili. Il numero di osservazioni attuali secondo i date: 15.
La fonte (nome):
Indicatori dello sviluppo mondiale
La fonte (organizzazione):
United Nations Educational, Scientific, and Cultural Organization (UNESCO) Institute for Statistics.
Categorie:
Education
sono stati aggiornati
23 apr 2017 anni
Indicatori delle variazioni dei valori per anni
In media:
12.67
Minima:
11.374
1 gen 2009 anni
Massimo:
14.325
1 gen 1999 anni
Alla data di osservazione
Valore
Variazione assoluta
La variazione rispetto al valore precedente
1 gen 1999 anni
14.325
+14.325
0.0%
1 gen 2000 anni
14.147
-0.178
-1.25%
1 gen 2001 anni
13.635
-0.511
-3.62%
1 gen 2002 anni
13.68
+0.044
0.32%
1 gen 2003 anni
13.538
-0.142
-1.04%
1 gen 2004 anni
13.58
+0.043
0.32%
1 gen 2005 anni
12.123
-1.458
-10.73%
1 gen 2006 anni
11.957
-0.166
-1.37%
1 gen 2007 anni
11.708
-0.249
-2.08%
1 gen 2008 anni
11.5
-0.207
-1.77%
1 gen 2009 anni
11.374
-0.126
-1.1%
1 gen 2010 anni
11.65
+0.275
2.42%
1 gen 2011 anni
12.125
+0.475
4.08%
1 gen 2012 anni
12.256
+0.131
1.08%
1 gen 2013 anni
12.452
+0.196
1.6%
Classificazione dei paesi secondo i statistiche attuali per anni