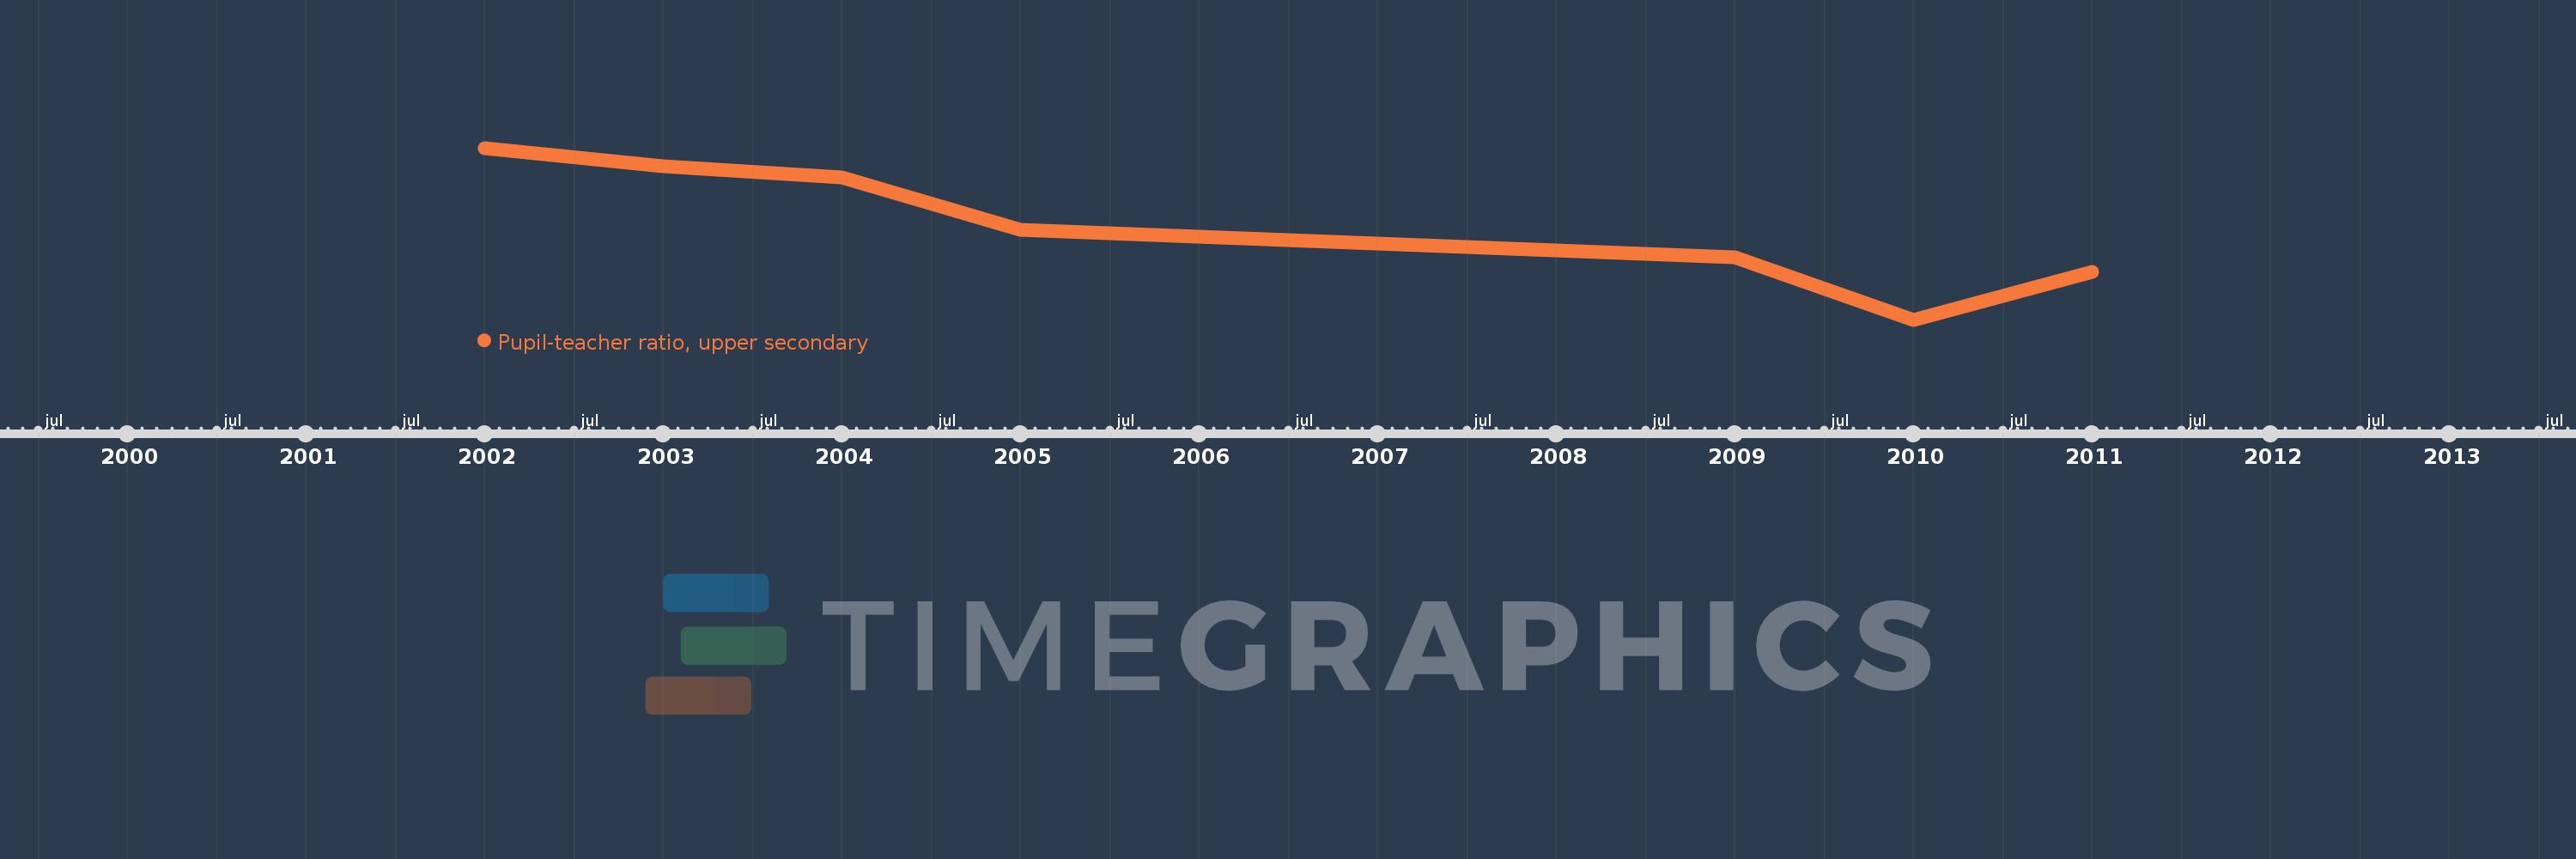
Questa scala temporale mostra un grafico dal 2002 anno al 2011 anno. St. Vincent and the Grenadines. I dati fino ad 2001 anno non disponibili. Il numero di osservazioni attuali secondo i date: 7.
La fonte (nome):
Indicatori dello sviluppo mondiale
La fonte (organizzazione):
United Nations Educational, Scientific, and Cultural Organization (UNESCO) Institute for Statistics.
Categorie:
Education
sono stati aggiornati
23 apr 2017 anni
Indicatori delle variazioni dei valori per anni
In media:
18.553
Minima:
11.599
1 gen 2010 anni
Massimo:
24.108
1 gen 2002 anni
Alla data di osservazione
Valore
Variazione assoluta
La variazione rispetto al valore precedente
1 gen 2002 anni
24.108
+24.108
0.0%
1 gen 2003 anni
22.787
-1.321
-5.48%
1 gen 2004 anni
21.984
-0.803
-3.52%
1 gen 2005 anni
18.129
-3.855
-17.54%
1 gen 2009 anni
16.176
-1.953
-10.77%
1 gen 2010 anni
11.599
-4.576
-28.29%
1 gen 2011 anni
15.086
+3.486
30.05%
Classificazione dei paesi secondo i statistiche attuali per anni