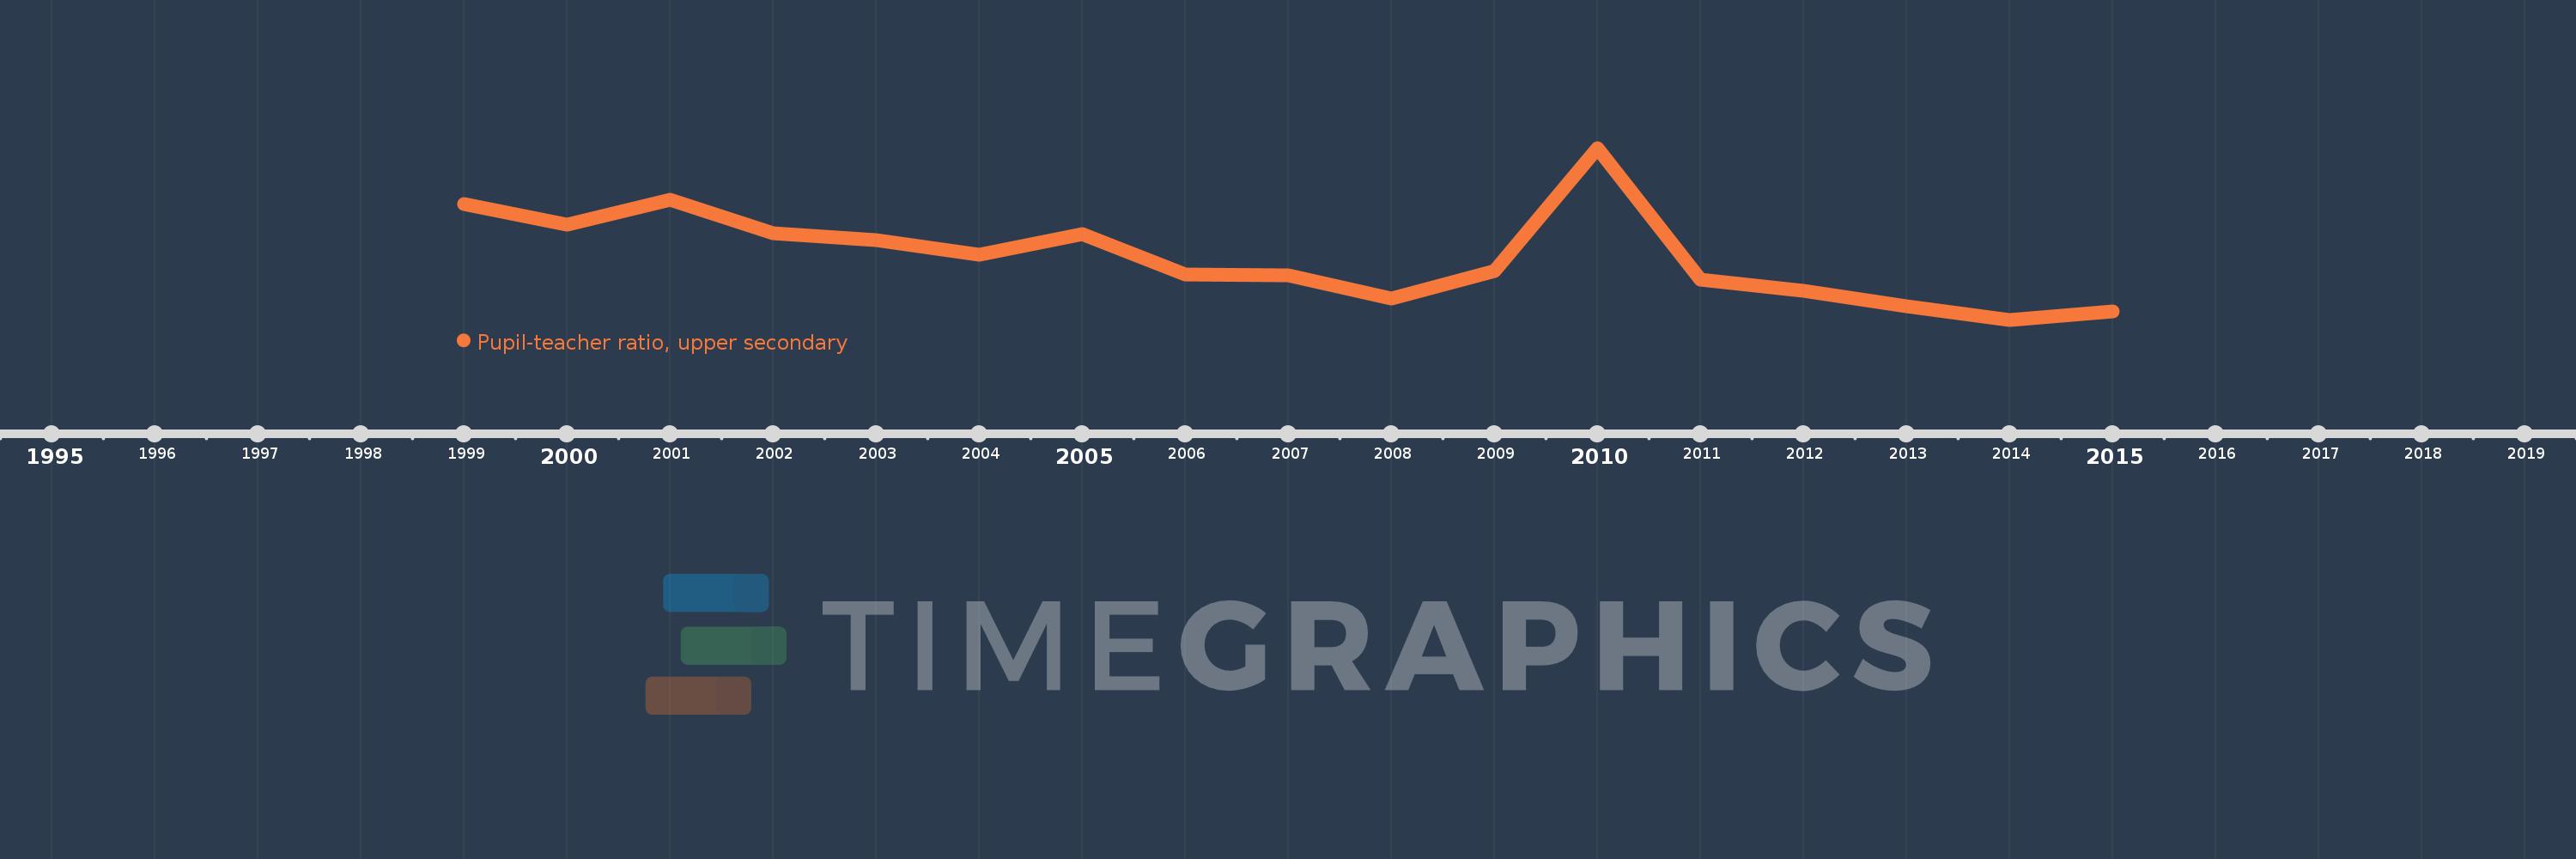
Questa scala temporale mostra un grafico dal 1999 anno al 2015 anno. Heavily indebted poor countries (HIPC). I dati fino ad 1998 anno non disponibili. Il numero di osservazioni attuali secondo i date: 17.
La fonte (nome):
Indicatori dello sviluppo mondiale
La fonte (organizzazione):
United Nations Educational, Scientific, and Cultural Organization (UNESCO) Institute for Statistics.
Categorie:
Education
sono stati aggiornati
23 apr 2017 anni
Indicatori delle variazioni dei valori per anni
In media:
19.348
Minima:
17.421
1 gen 2014 anni
Massimo:
22.693
1 gen 2010 anni
Alla data di osservazione
Valore
Variazione assoluta
La variazione rispetto al valore precedente
1 gen 1999 anni
20.96
+20.96
0.0%
1 gen 2000 anni
20.35
-0.61
-2.91%
1 gen 2001 anni
21.094
+0.744
3.66%
1 gen 2002 anni
20.07
-1.025
-4.86%
1 gen 2003 anni
19.855
-0.215
-1.07%
1 gen 2004 anni
19.409
-0.445
-2.24%
1 gen 2005 anni
20.051
+0.642
3.31%
1 gen 2006 anni
18.807
-1.244
-6.2%
1 gen 2007 anni
18.772
-0.035
-0.19%
1 gen 2008 anni
18.065
-0.707
-3.77%
1 gen 2009 anni
18.905
+0.84
4.65%
1 gen 2010 anni
22.693
+3.788
20.04%
1 gen 2011 anni
18.645
-4.048
-17.84%
1 gen 2012 anni
18.318
-0.328
-1.76%
1 gen 2013 anni
17.822
-0.495
-2.7%
1 gen 2014 anni
17.421
-0.401
-2.25%
1 gen 2015 anni
17.675
+0.254
1.46%
Classificazione dei paesi secondo i statistiche attuali per anni