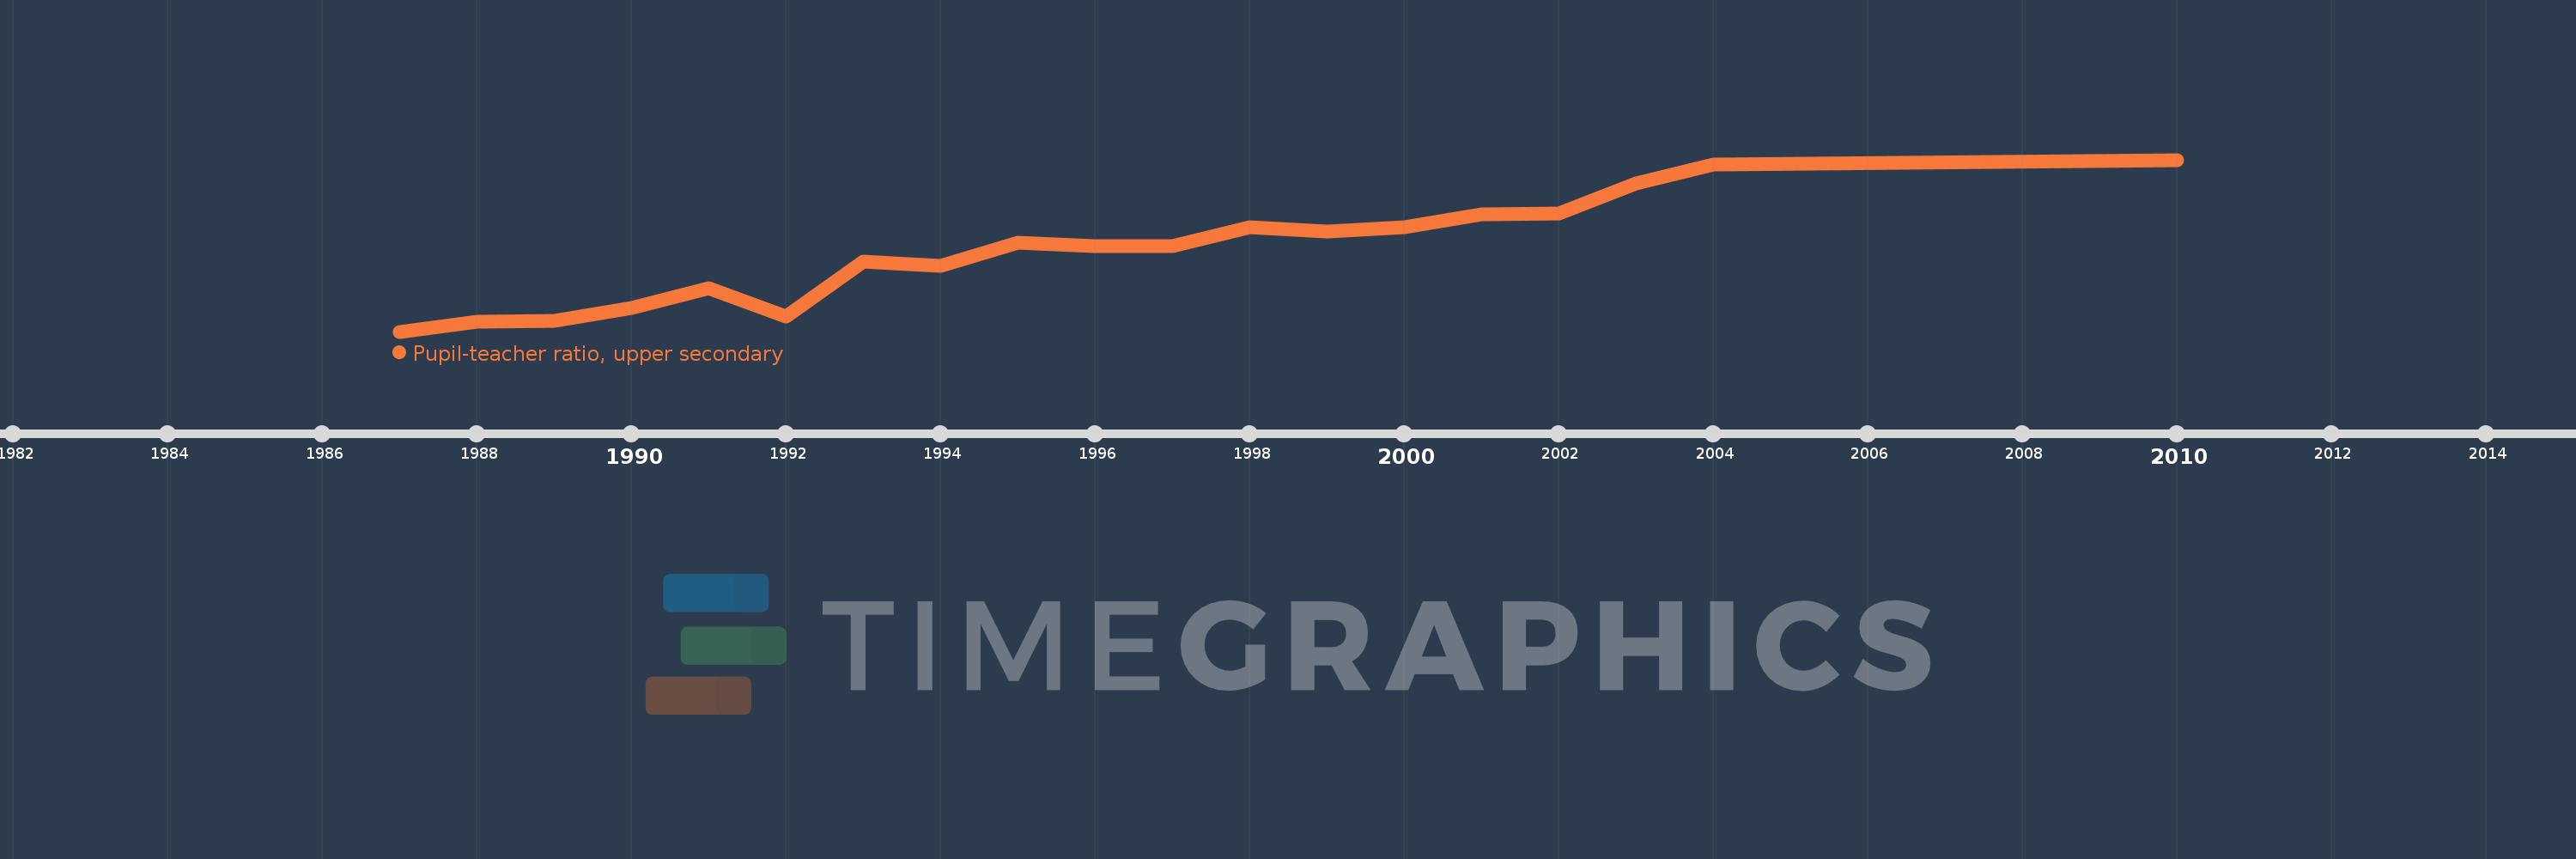
Questa scala temporale mostra un grafico dal 1987 anno al 2010 anno. Oman. I dati fino ad 1986 anno non disponibili. Il numero di osservazioni attuali secondo i date: 19.
La fonte (nome):
Indicatori dello sviluppo mondiale
La fonte (organizzazione):
United Nations Educational, Scientific, and Cultural Organization (UNESCO) Institute for Statistics.
Categorie:
Education
sono stati aggiornati
23 apr 2017 anni
Indicatori delle variazioni dei valori per anni
In media:
14.818
Minima:
10.092
1 gen 1987 anni
Massimo:
20.178
1 gen 2010 anni
Alla data di osservazione
Valore
Variazione assoluta
La variazione rispetto al valore precedente
1 gen 1987 anni
10.092
+10.092
0.0%
1 gen 1988 anni
10.678
+0.586
5.81%
1 gen 1989 anni
10.736
+0.058
0.54%
1 gen 1990 anni
11.491
+0.755
7.04%
1 gen 1991 anni
12.639
+1.148
9.99%
1 gen 1992 anni
10.981
-1.657
-13.11%
1 gen 1993 anni
14.226
+3.245
29.55%
1 gen 1994 anni
13.955
-0.272
-1.91%
1 gen 1995 anni
15.295
+1.34
9.6%
1 gen 1996 anni
15.1
-0.195
-1.28%
1 gen 1997 anni
15.113
+0.013
0.09%
1 gen 1998 anni
16.216
+1.103
7.3%
1 gen 1999 anni
15.956
-0.26
-1.6%
1 gen 2000 anni
16.217
+0.262
1.64%
1 gen 2001 anni
16.972
+0.754
4.65%
1 gen 2002 anni
17.01
+0.038
0.23%
1 gen 2003 anni
18.794
+1.784
10.49%
1 gen 2004 anni
19.89
+1.096
5.83%
1 gen 2010 anni
20.178
+0.288
1.45%
Classificazione dei paesi secondo i statistiche attuali per anni